

Appearance
Run a Device Check #
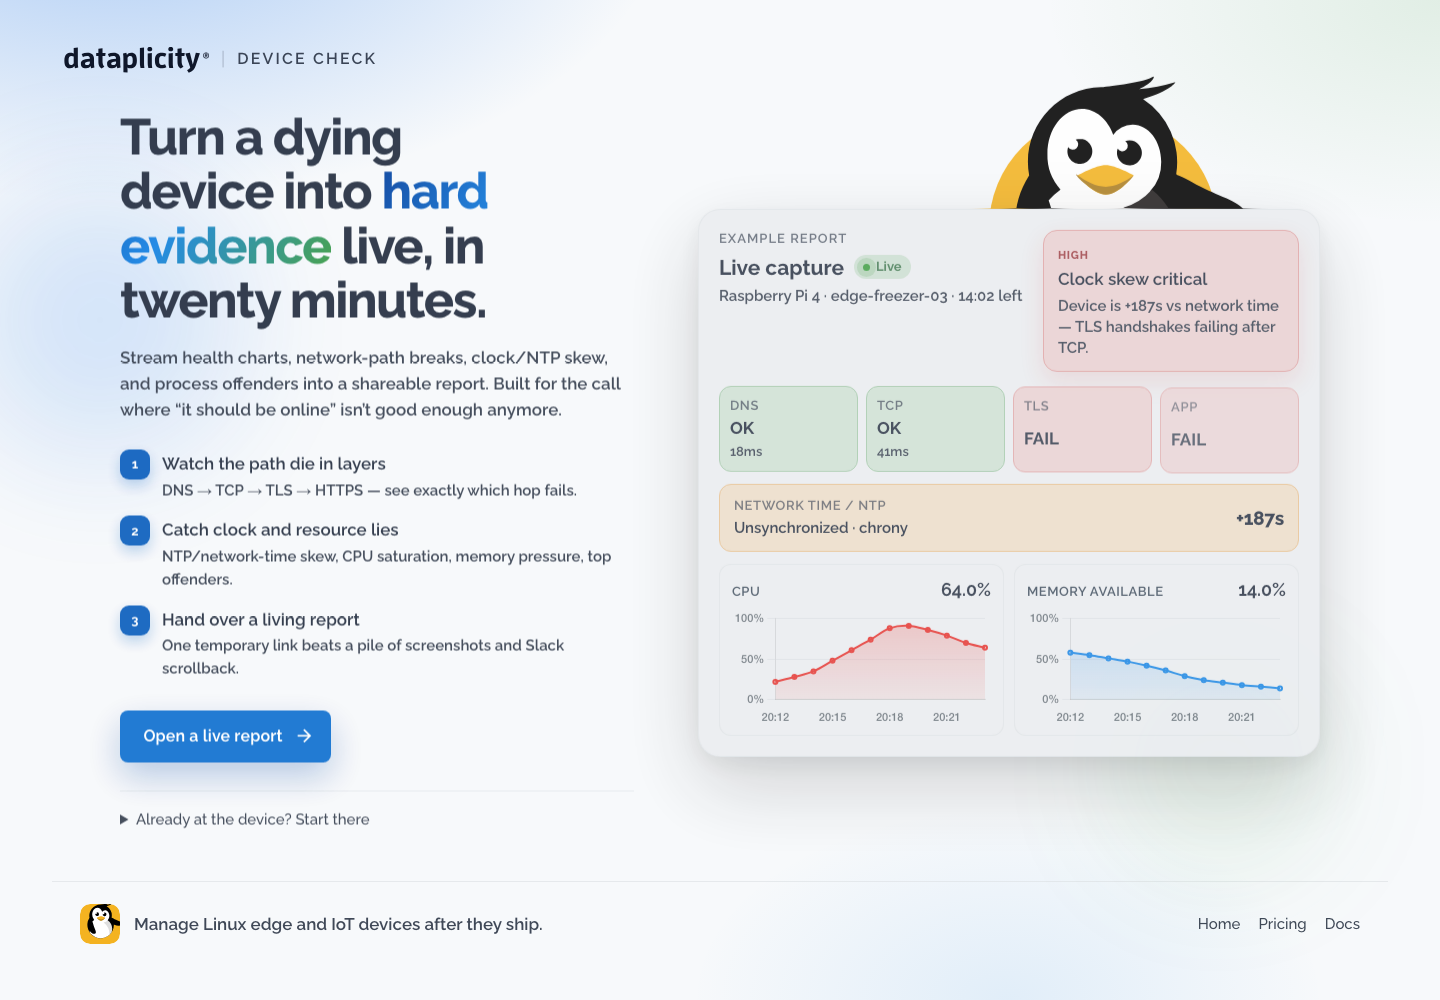
Device Check turns a difficult Linux device into a temporary, shareable diagnostic report. It samples the device for 20 minutes and shows what changed during the capture, without installing the Dataplicity agent or other permanent software. The service is free, requires no account, and deletes completed report data after about 14 days.
When to use it #
Use Device Check when:
- a device is unstable, slow, intermittently offline, or close to failure
- you need evidence before restarting a service or power-cycling the device
- a device is not enrolled in Dataplicity
- an engineer or support operator needs one report instead of separate terminal output and screenshots
- you need to distinguish DNS, TCP, TLS, and AlwaysOn web-check failures
Device Check is designed for Linux edge and IoT devices. It needs curl, Python 3, outbound HTTPS, working DNS, and a writable /tmp directory.
Start a capture #
- Open Device Check.
- Select Open a live report.
- Copy one of the commands shown in the report.
- Run the command in a terminal on the device within 10 minutes.
- Keep the report open while the 20-minute capture runs. New samples appear as the device uploads them.
- Share the report link with the person investigating the device, if needed.
Choose the right command #
Device Check offers three modes:
- Without sudo collects health, network-path, clock, and process information available to the current user.
- With sudo adds deeper kernel and journal checks where elevated access helps.
- With sudo and security checks explicitly enables checks for account configuration, update policy, local TLS certificates, and access controls.
Use the least privilege that gives you the evidence you need. The security checks do not upload passwords, account names, or raw authentication logs.
Before running the command, select View what runs on the device to inspect both the short run.sh bootstrap and the Python collector. The bootstrap downloads the collector into a temporary directory, runs it once, and removes the temporary files when the check finishes.
Read the report #
The report keeps capture timing and device identity visible while you move between:
- Findings for prioritised observations from the capture
- Device health for CPU, memory, load, and disk trends
- Network path for DNS, TCP, TLS, and AlwaysOn web-check results
- Network time for clock and NTP state
- Processes for the largest resource users
- Timeline for notable events during the run
- Coverage for completed, skipped, or unavailable checks
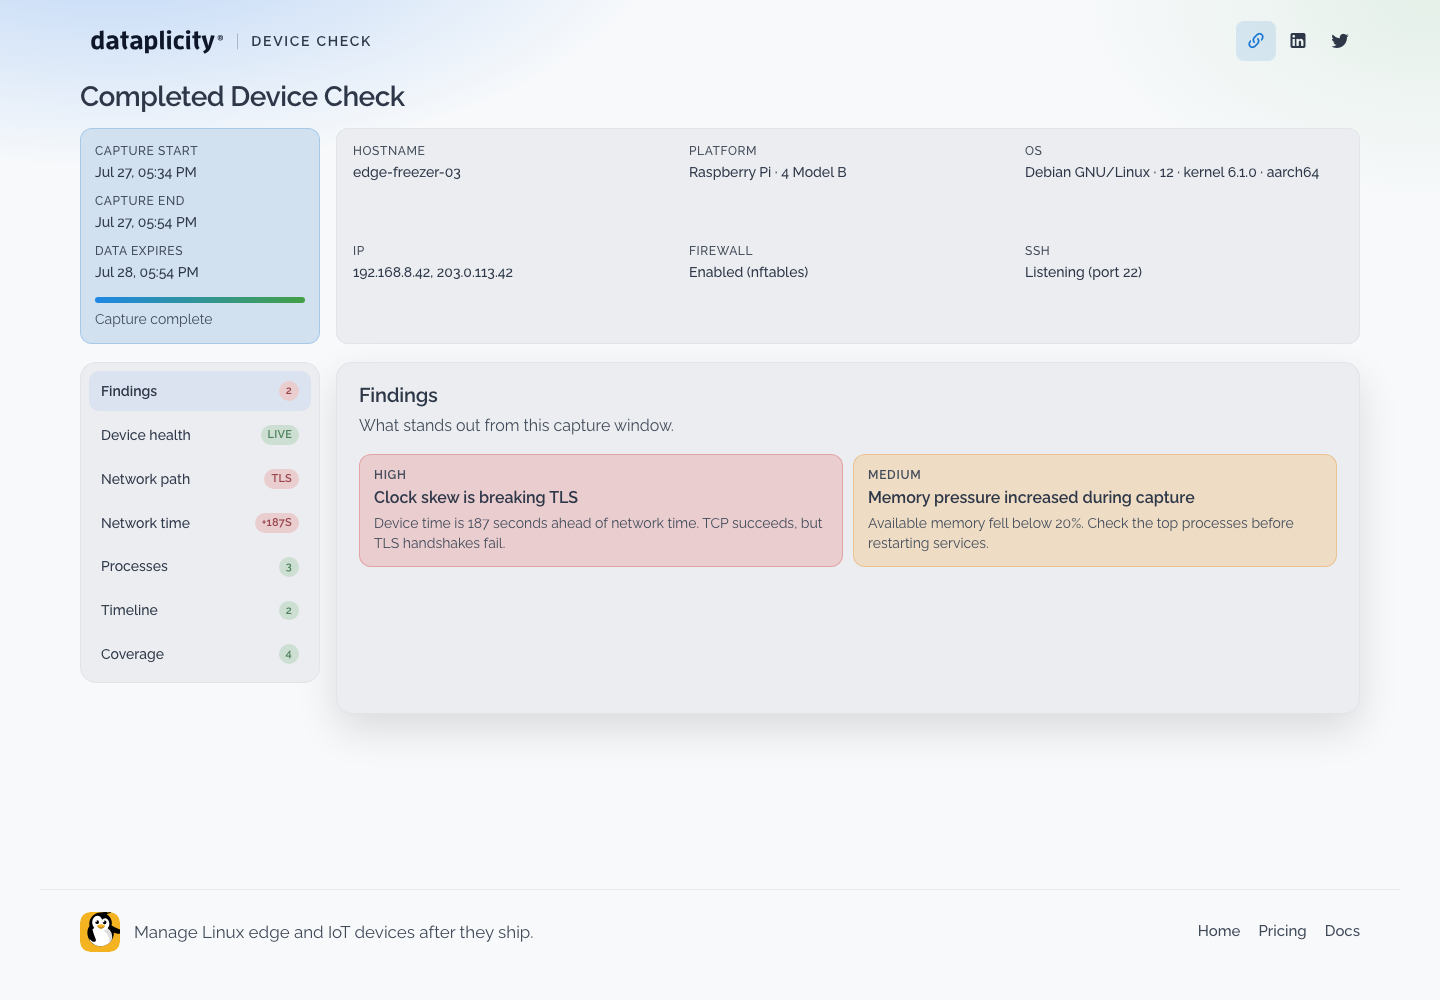
A failed layer can make later network checks unavailable. For example, a TLS failure after successful DNS and TCP checks points to certificate, clock, or interception problems rather than basic routing. The final layer is an AlwaysOn web check against alwayson.dataplicity.com, not a check of your application.
Temporary reports and sharing #
Device Check reports are temporary:
- an unopened report waits up to 10 minutes for its first device connection
- the live capture runs for 20 minutes after the device connects
- completed report data expires after 14 days
- nothing is installed permanently on the device
The owner report includes a share action. Shared reports hide hostname, IP addresses, and hardware serials. Treat every report link as sensitive operational information and send it only to people who need it.
If the device does not connect #
Check that:
- the command was copied from the current report
- the device can resolve public DNS names
- outbound HTTPS is allowed without an intercepting proxy breaking TLS
- the system clock is reasonably accurate
curland Python 3 are installed/tmpis writable
If the waiting window expired, start a new Device Check. A command from an expired report cannot attach data to a replacement report.