

Appearance
Build a customer-operated telemetry product #
Give customers a numeric reading they can identify, trust, and act on. The finished product shows the current value with its unit and freshness, preserves useful history, and makes warning state explicit instead of leaving someone to interpret a raw number.
This guide takes one Linux device from a working local reading to a customer-operated portal. The example uses cold-room temperature, but the same path works for pressure, flow, signal strength, current, speed, vibration, and other numeric telemetry.
You finish with:
- a product Device Class
- a stable numeric stream with meaningful units and history
- explicit warning state instead of an unexplained number
- one safe operation or persistent setting where the product needs it
- a customer page designed around identity, freshness, current state, and trend
- the first device allocated and verified by customer role
Before you start #
You need:
- a supported Linux device with a working sensor application
- the Dataplicity agent and access to Device Classes
- a customer and portal administrator test account
- an agreed unit, plausible range, and reporting cadence
If hardware is not ready, open Engineering > Software, select the Device Class, and attach fridge-temp-sim or hvac-sim under Containers. The simulator proves stream, layout, allocation, and portal behavior. It does not prove a real probe, installation, or control loop.
Part 1: Define what the number means #
Write the product contract before creating a stream:
| Decision | Cold-room example |
|---|---|
| Customer quantity | Air temperature |
| Unit | °C |
| Plausible range | -30 to 30 |
| Expected cadence | Every 30 seconds |
| Useful history | 24 hours for shift review |
| Warning state | High or low threshold exceeded |
| Missing meaning | Probe or publisher unavailable |
| Stale meaning | Device online, but no recent product sample |
Use a name the customer recognises. cold_room_temp_c is a better contract than modbus_register_40112. Keep the implementation detail inside the device adapter.
Do not make a customer infer warning state from a chart. Publish explicit boolean state such as temperature_high and temperature_low when the decision depends on thresholds.
Part 2: Create the product Device Class #
- Open Engineering > Device classes.
- Choose New device class.
- Name it
Cold Room Monitor. - Select the representative hardware architecture.
- Describe the supported sensor and runtime combination.
- Create the class.
Under Engineering > Software > I/O, select the Device Class and add:
| Product concept | Class definition |
|---|---|
| Current reading | cold_room_temp_c numeric stream, unit °C |
| History | Chart based on cold_room_temp_c |
| Explicit state | temperature_high and temperature_low booleans |
| One-off operation | Run probe test trigger action |
| Persistent preference | Temperature setpoint or reporting interval with safe bounds |
Only expose a setpoint when the device genuinely controls it. A monitor that cannot alter the physical process should not present a control-looking setting.
Fast path: use an example #
- Open Engineering > Software and select Cold Room Monitor.
- Under Containers, choose Add container.
- Select a Dataplicity-managed example.
- Select Fridge temperature (sim) (
fridge-temp-sim) or HVAC (sim) (hvac-sim). - Attach the example and review its class parameter overrides.
- Under Builds, create a Build that selects the example version.
- Assign the Build to a tagged staging cohort, or select it as the class default.
Follow Example simulators for the managed-example path and Software Builds and cohorts for targeting.
Production path: publish from your runtime #
Your sensor application may stay under systemd, Docker, Podman, or its current supervisor. Create a small publisher that validates the reading and sends it to the local agent broker:
text
POST http://127.0.0.1:18765/v1/streams/cold_room_temp_cjson
{
  "sequence": 1,
  "timestamp_ms": 1710000000000,
  "body": { "value": 3.8 },
  "metadata": { "source": "temperature-adapter" }
}The publisher contains no Dataplicity cloud credential. The agent authenticates delivery. The class stream's History setting controls retention; a publisher storageProfile does not override it.
Part 3: Connect the representative device #
- Open Engineering > Devices.
- Choose Add device and select Cold Room Monitor.
- Copy the current class-specific installer command.
- Run it on the representative Linux device.
- Wait for the new device to become Online.
- Confirm the publisher or simulator is running.
- Confirm the stream unit, cadence, and current value.
- Compare at least one cloud value with the local sensor application.
Treat the real installer command as a secret. Do not place it in documentation, screenshots, source control, or tickets.
Test representative minimum, normal, and maximum values. A page designed only against 3.8 °C can fail badly when the product reports -29.7 °C, 0, or an invalid spike.
Part 4: Design the customer's page #
Open UI Designer and arrange:
- customer-readable product name, site, and serial
- device connectivity and last report
- current measurement with unit and data freshness
- explicit normal, high, low, or fault state beside the value
- history over the period used for the operating decision
- one bounded action or setting, only when the customer should use it
- support context
Use a metric for the current reading and a chart only when history changes a decision. Do not add every signal the device can publish. The customer product page is an operating surface, not an engineering telemetry dump.
Preview:
- no sample yet
- device online but reading stale
- device offline
- normal value
- high and low warning values
- invalid or implausible value
- action requested and awaiting confirmation
- viewer role with controls absent
Part 5: Create the first customer #
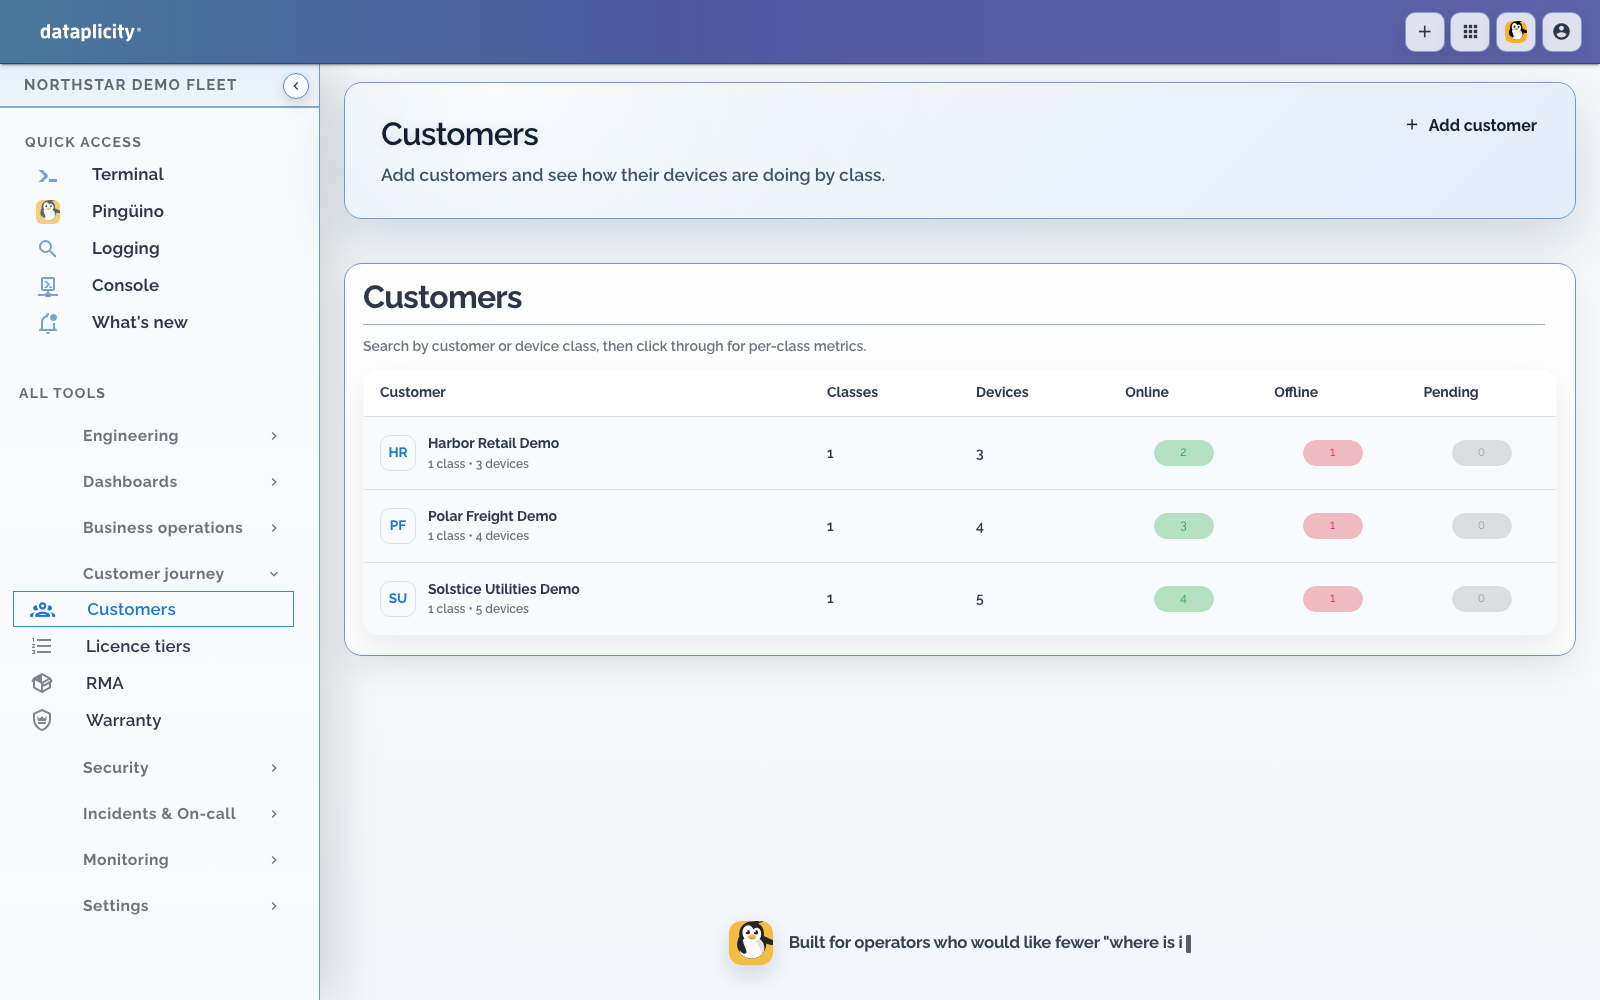
- Open Customer journey > Customer Portal.
- Confirm branding, sign-in copy, and support link.
- Open Customer journey > Customers.
- Create the downstream customer and first administrator.
- Sign in to the portal and create the network representing the real operating location, such as
Distribution Centre 4. - Invite one read-only viewer for boundary testing.
The network is the current portal placement boundary. It can represent a building, room, cabinet, vehicle, or another customer location.
Part 6: Allocate and place the device #
- Return to Engineering > Devices.
- Find the verified Cold Room Monitor.
- Choose Allocate to customer.
- Select the intended customer and confirm.
- Sign in to the Customer Portal as the administrator.
- Open Devices. If the online device has no network, it is Ready and does not yet participate in place-level application work.
- In this seeded example, assign the gauge to
Riverbend Yard; it is now Enabled.
Allocation is the audited ownership handover. Complete sensor, stream, and layout verification before moving the unit.

Part 7: Verify the customer experience #
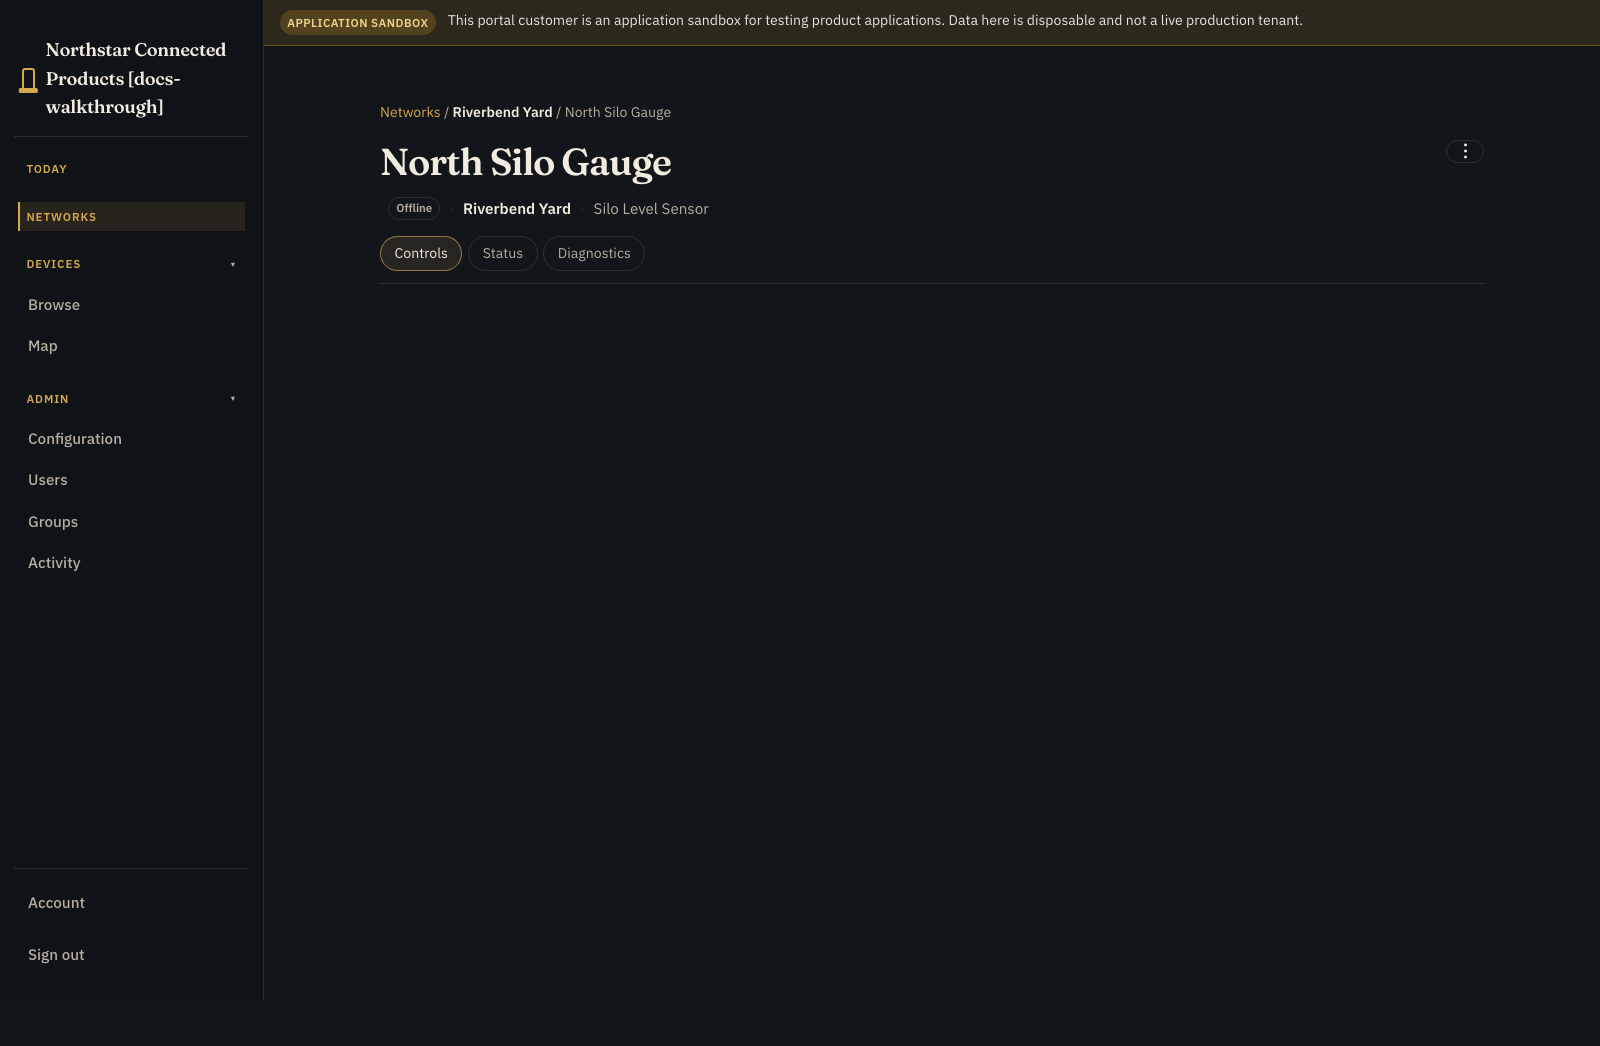
Open the place from Networks, then open the device. The Device Class layout you authored in UI Designer is always on Controls. Use Status for identity and connection context and Diagnostics for connection tests. Administrative device actions are in the ⋮ menu.
Viewer #
- sees only the intended customer locations and devices
- can identify the physical product
- sees current value, unit, freshness, warning state, and useful history
- cannot run actions or change settings
- cannot see OEM logs, Remote Shell, software, or fleet-wide controls
Operator #
- sees only controls required for the operating job
- cannot enter values outside the documented setting bounds
- receives useful pending, success, or failure state after an action
Admin #
- can place devices only within permitted customer networks
Test another customer account and prove the device, location, and telemetry are absent.
Part 8: Add operations without cluttering the customer page #
The OEM engineering workspace is where you add:
- logs from the sensor application
- monitors for device connectivity and customer-impacting state
- alerts and incident handling
- Device Class Pulse for peer drift
- Fleet Jobs and remote access for bounded support work
- Software containers and Builds when Dataplicity should version and release the application
The customer page should continue to show product state and permitted controls, not OEM diagnostics.
Production handover gate #
- [ ] The value matches a trusted local reading.
- [ ] Unit, precision, cadence, and plausible range are documented.
- [ ] Missing, stale, offline, warning, and invalid states differ.
- [ ] History uses the period relevant to the customer's job.
- [ ] Viewer roles have no actions or settings.
- [ ] Every control is supported, bounded, and validated on the device.
- [ ] The device reconnects after power and network loss.
- [ ] Another customer cannot see the device or its telemetry.
- [ ] OEM support can diagnose the product without exposing engineering tools.
- [ ] Probe replacement and recalibration procedures are documented.