

Appearance
Investigate Process executions #
The execution debugger uses persisted Process truth from production and test runs. Open a Product Application and choose Executions, or open the execution history embedded in one Process workspace.
Start with health, then narrow the search #
Choose a health window and review executions, failures, needs-attention cases, incomplete traces, active work, stuck work, failure rate, safety states, failure categories, and Process-level patterns.
Search by execution, customer, or correlation. Filters can narrow by:
- status and production or test environment
- Process and Product Version
- failure category and code
- correlation, instance, site, or device
- wait subtype
- start time range
Health answers whether the symptom is isolated or systemic. The execution trace answers what happened in one run.
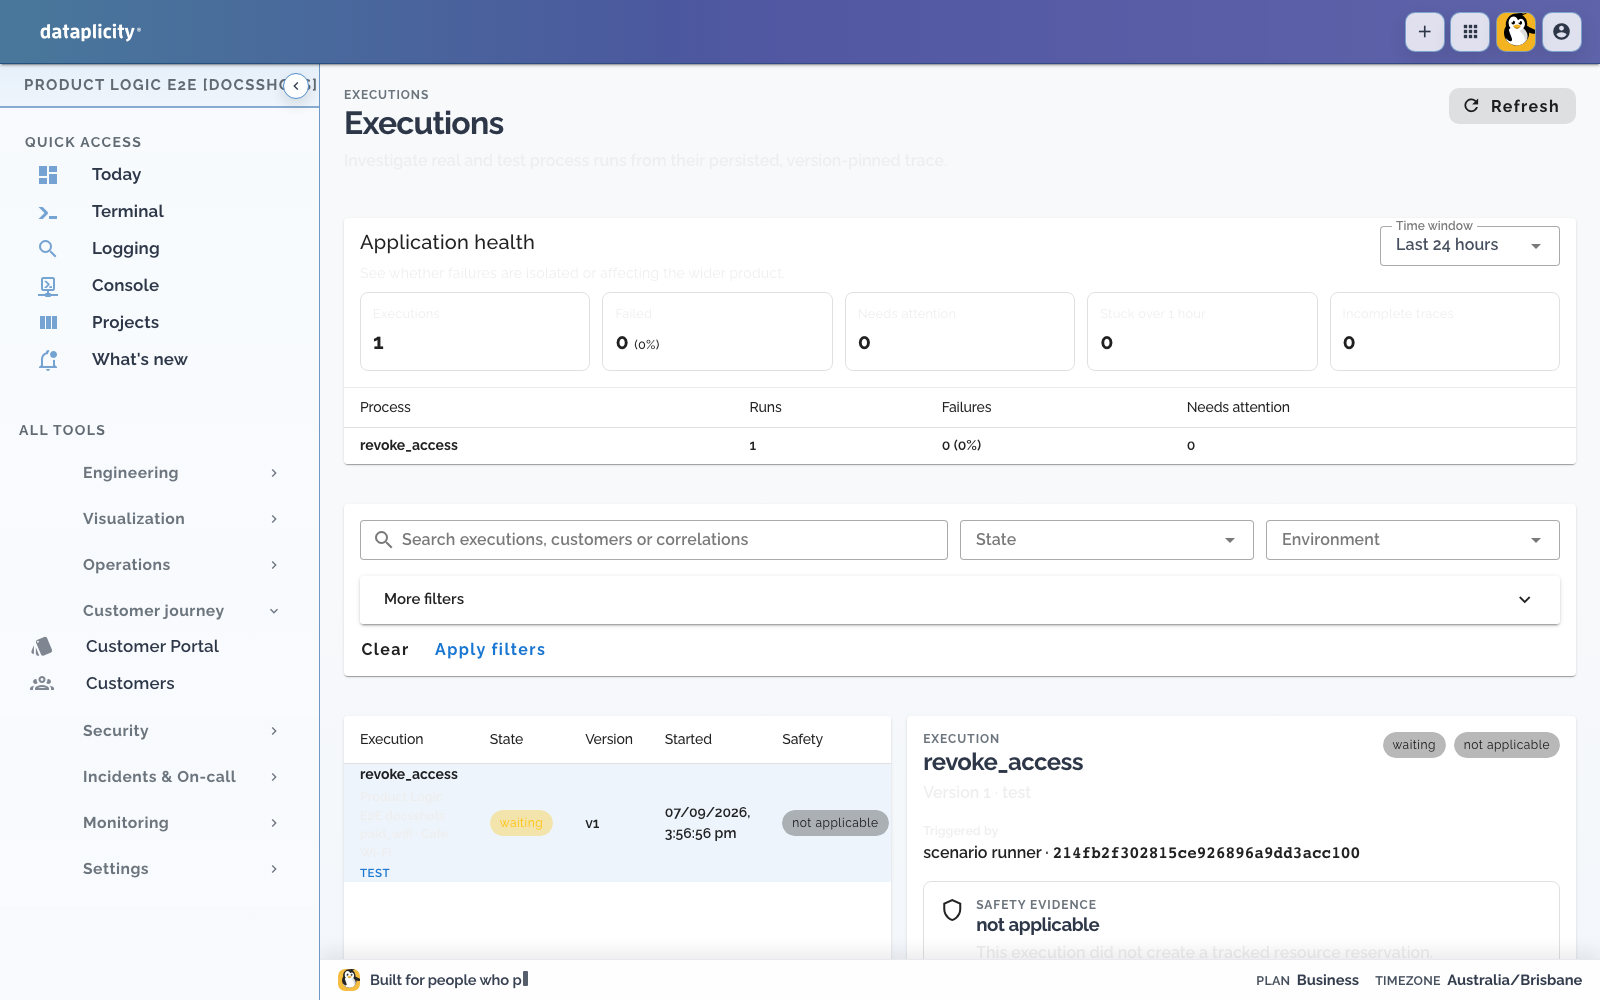
Confirm identity and trace quality #
Before reading a failed step, confirm:
- Product Instance and customer
- Process key and status
- production or test environment
- exact Product Version number and identifier
- trigger type and reference
- correlation identifier
- trace completeness
A partial, expired, or legacy trace cannot support the same conclusions as a complete trace. Treat missing evidence as unknown, not as success.
Follow the exact historical path #
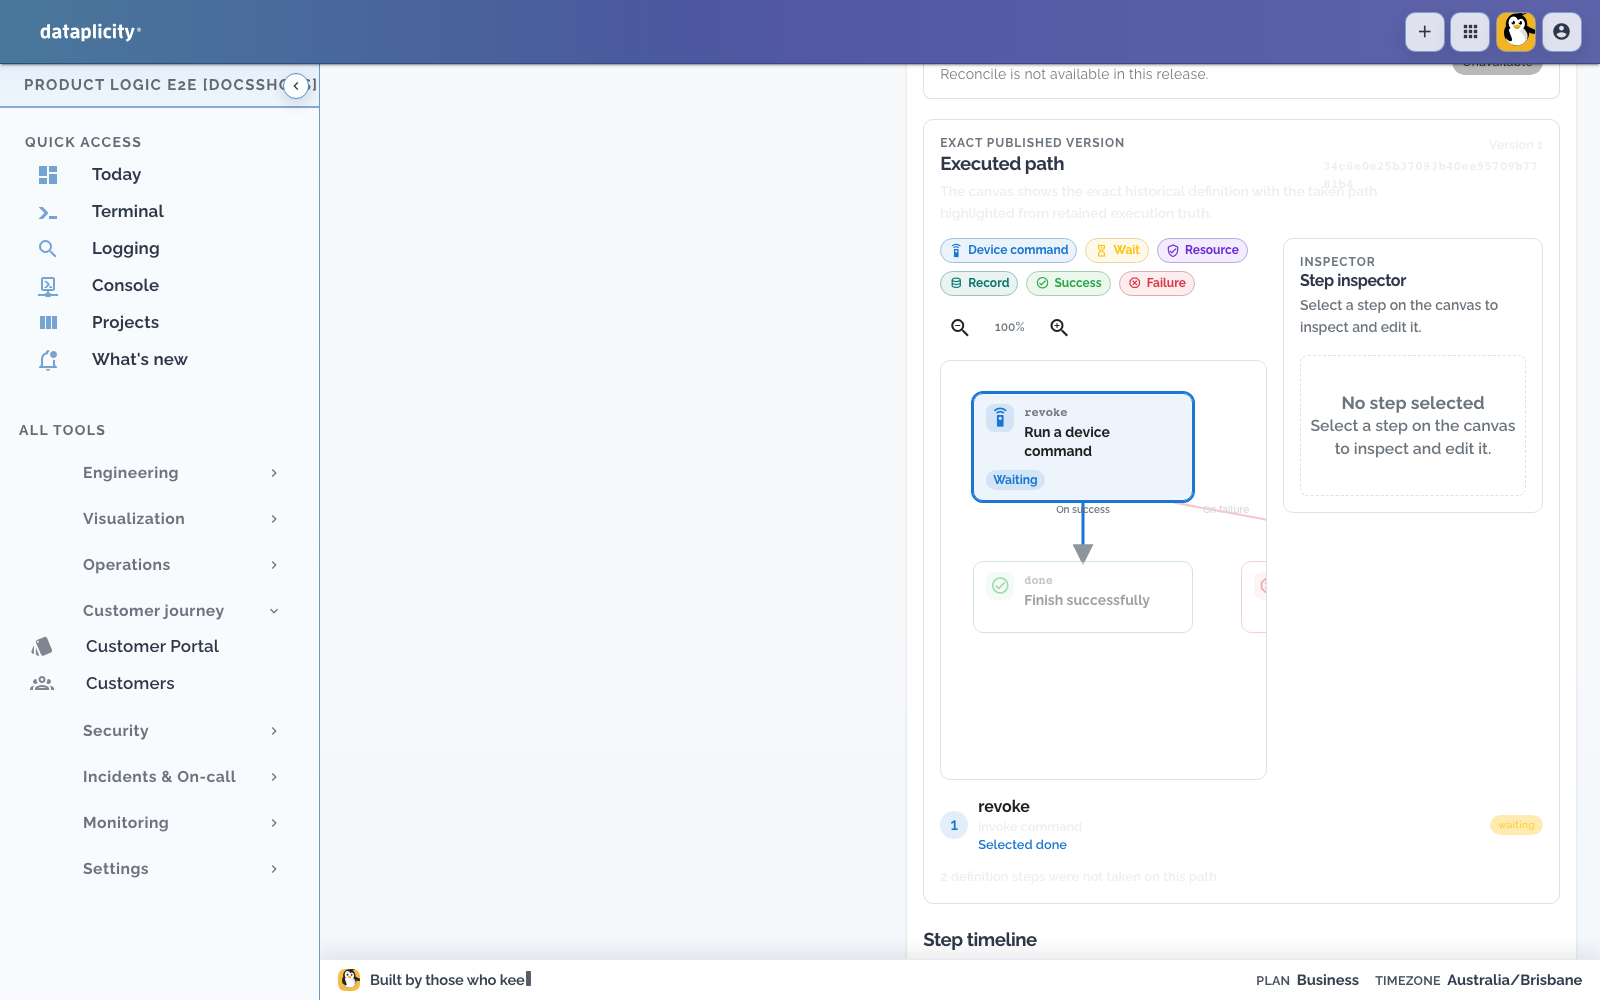
The debugger loads the Process definition pinned to the execution's Product Version. It does not redraw the current draft.
The path view overlays persisted attempts on that historical definition. It shows taken transitions, attempted nodes, current or failed work, and untaken nodes. For a Mixed Process, enter an Edge segment to inspect its nested path.
Select an attempt to inspect:
- evaluated inputs and outputs
- branch decisions
- error and retry data
- references to related records, Commands, reservations, or events
- snapshot and trace metadata
This preserves the distinction between what the Process definition allowed and what the run actually did.
Use correlation to reconstruct the wider operation #
Open related activity by correlation identifier to see the ordered chain of available facts across:
- executions and step attempts
- Commands
- reservations and ledger entries
- events
- retained trace facts
Correlation connects the customer intent to downstream work. It is not a promise that every external system retained the same identifier. Check omitted fact types and trace completeness before declaring the chain complete.
Read safety independently from status #
Execution status and safety state answer different questions. A failed Process can be compensated, while a completed technical path can still need attention if a tracked reservation remains active.
Safety states distinguish:
- safe
- compensated
- attention required
- unknown
- not applicable
Inspect the evidence behind the label. Dataplicity can report tracked reservations and compensation, but physical safety remains enforced and verified by the device and its qualified control system.
Intervene deliberately #
The debugger asks the server for an intervention catalogue. It can describe cancel, retry step, resume, compensate, and reconcile actions together with availability, consequences, and the reason an action is unavailable.
In the current UI, Cancel execution is the actionable intervention. It requires:
- an available cancel action for the current state
- a human reason
- an idempotency key
- confirmation after reviewing the consequence summary
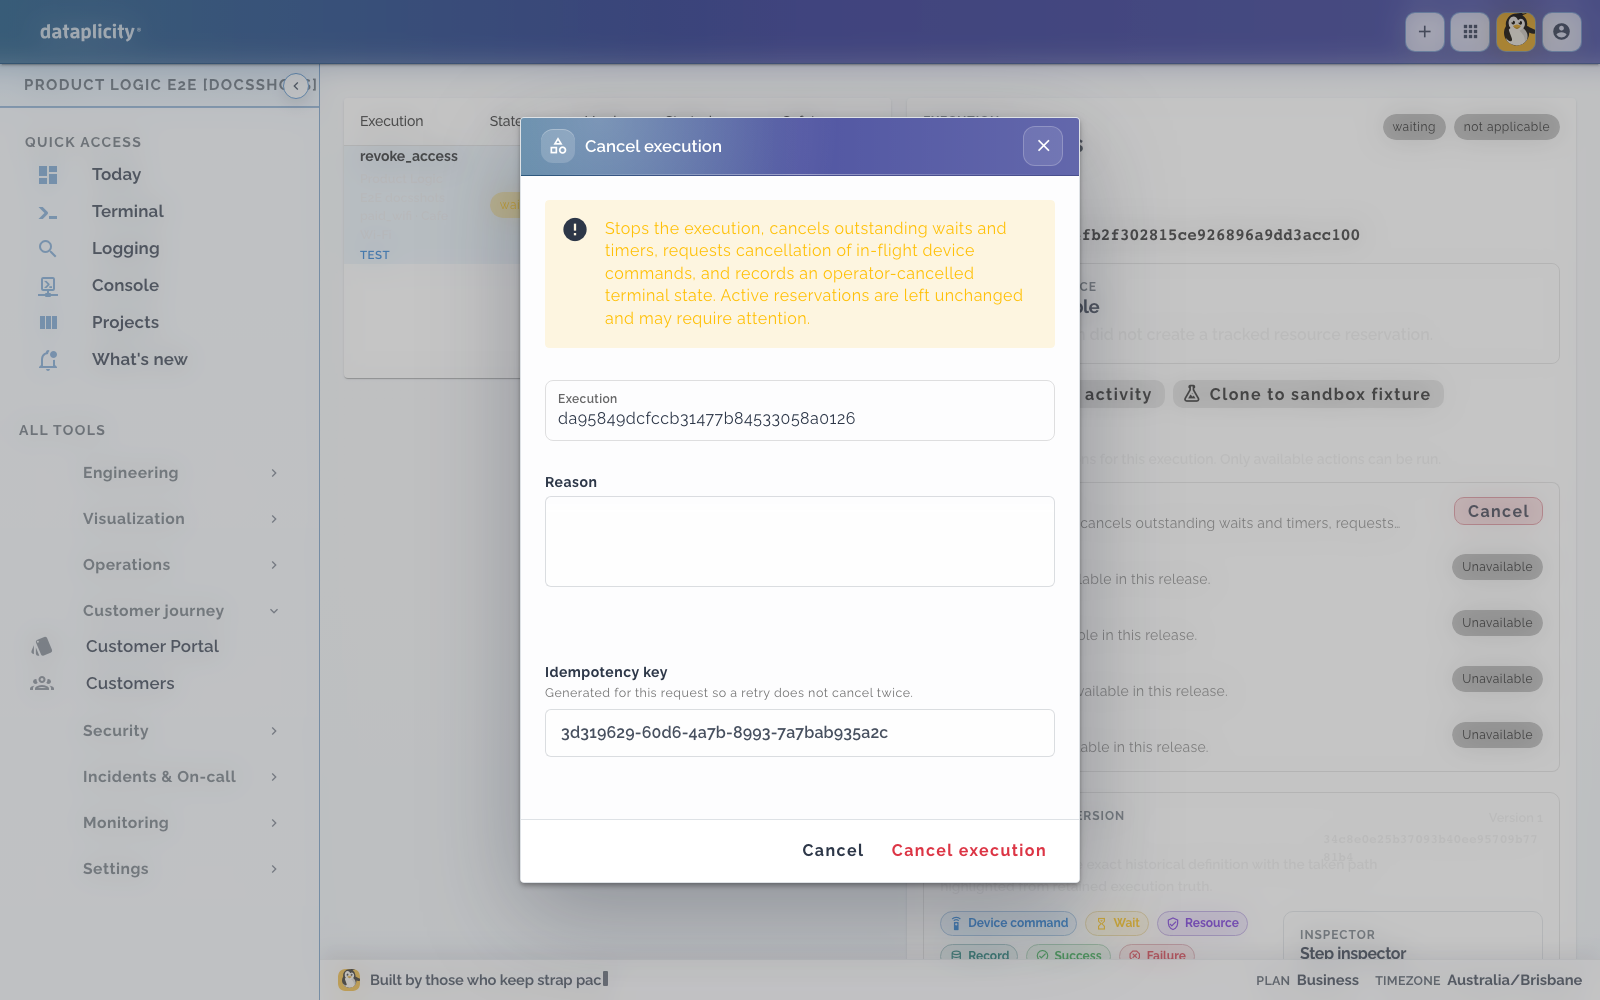
Cancellation is a state transition, not an undo operation. It does not reverse physical side effects or replace compensation and reconciliation.
Do not claim that retry, resume, compensate, or reconcile can be performed from the debugger merely because they appear in the catalogue. Treat them as capability information unless the action is explicitly available and exposed.
Clone a failure into the sandbox #
When the retained execution is useful as a regression case:
- Choose the clone-to-sandbox action.
- Select an existing application sandbox.
- Name the fixture.
- Include and review the response plan.
- Add assertions for the observed outcome and the intended safe state.
The new fixture records its source execution. Run it only in the sandbox, then compare it with the original trace. See Test application scenarios.