

Appearance
Semantic composition for Product Applications #
Semantic composition is the published contract that turns Product Application records into curated Customer Portal workplaces. You declare facets (reusable semantic widgets), optional event streams, and page archetypes such as capacity. The portal renders those facets; you do not hand-author an arbitrary widget canvas for each customer.
Use this page when you are extending a first-class kit (for example silo monitoring) or reviewing composition JSON on a published Product Version. For the full facet and supporting-widget inventory, see Semantic widget catalogue.
Worked example: silo capacity #
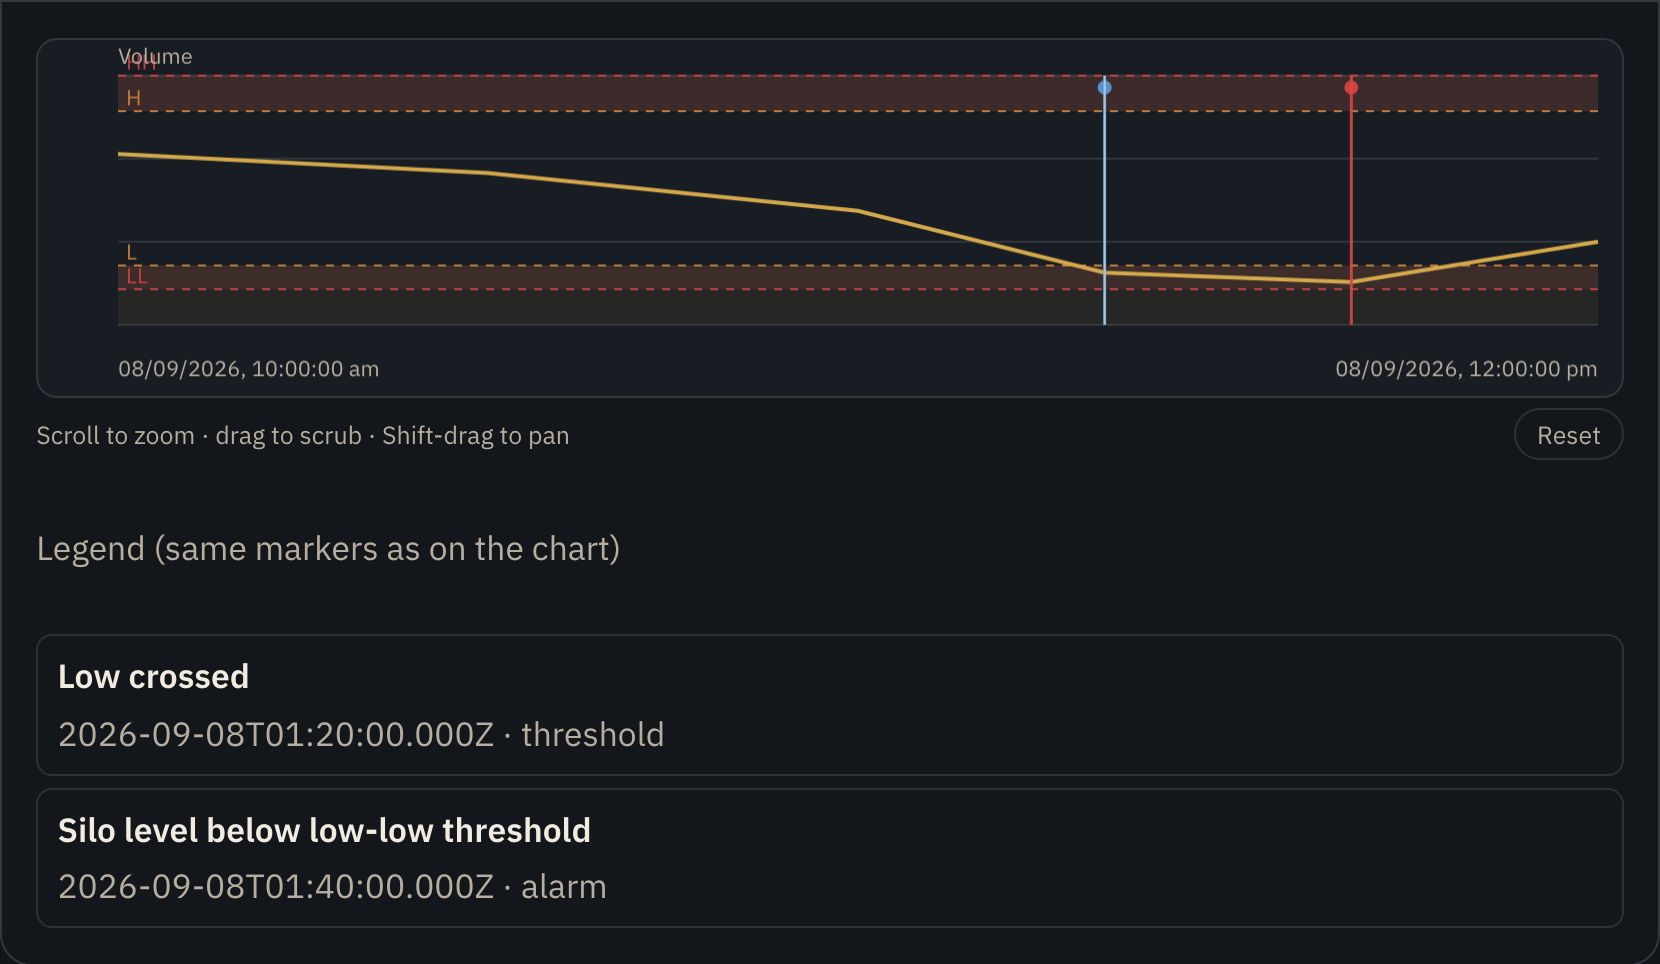
Silo monitoring is the clearest first-class composition. One published contract produces a workplace grid: each silo record gets the same ordered facet stack, and hosts that share a record share the same overlay markers.
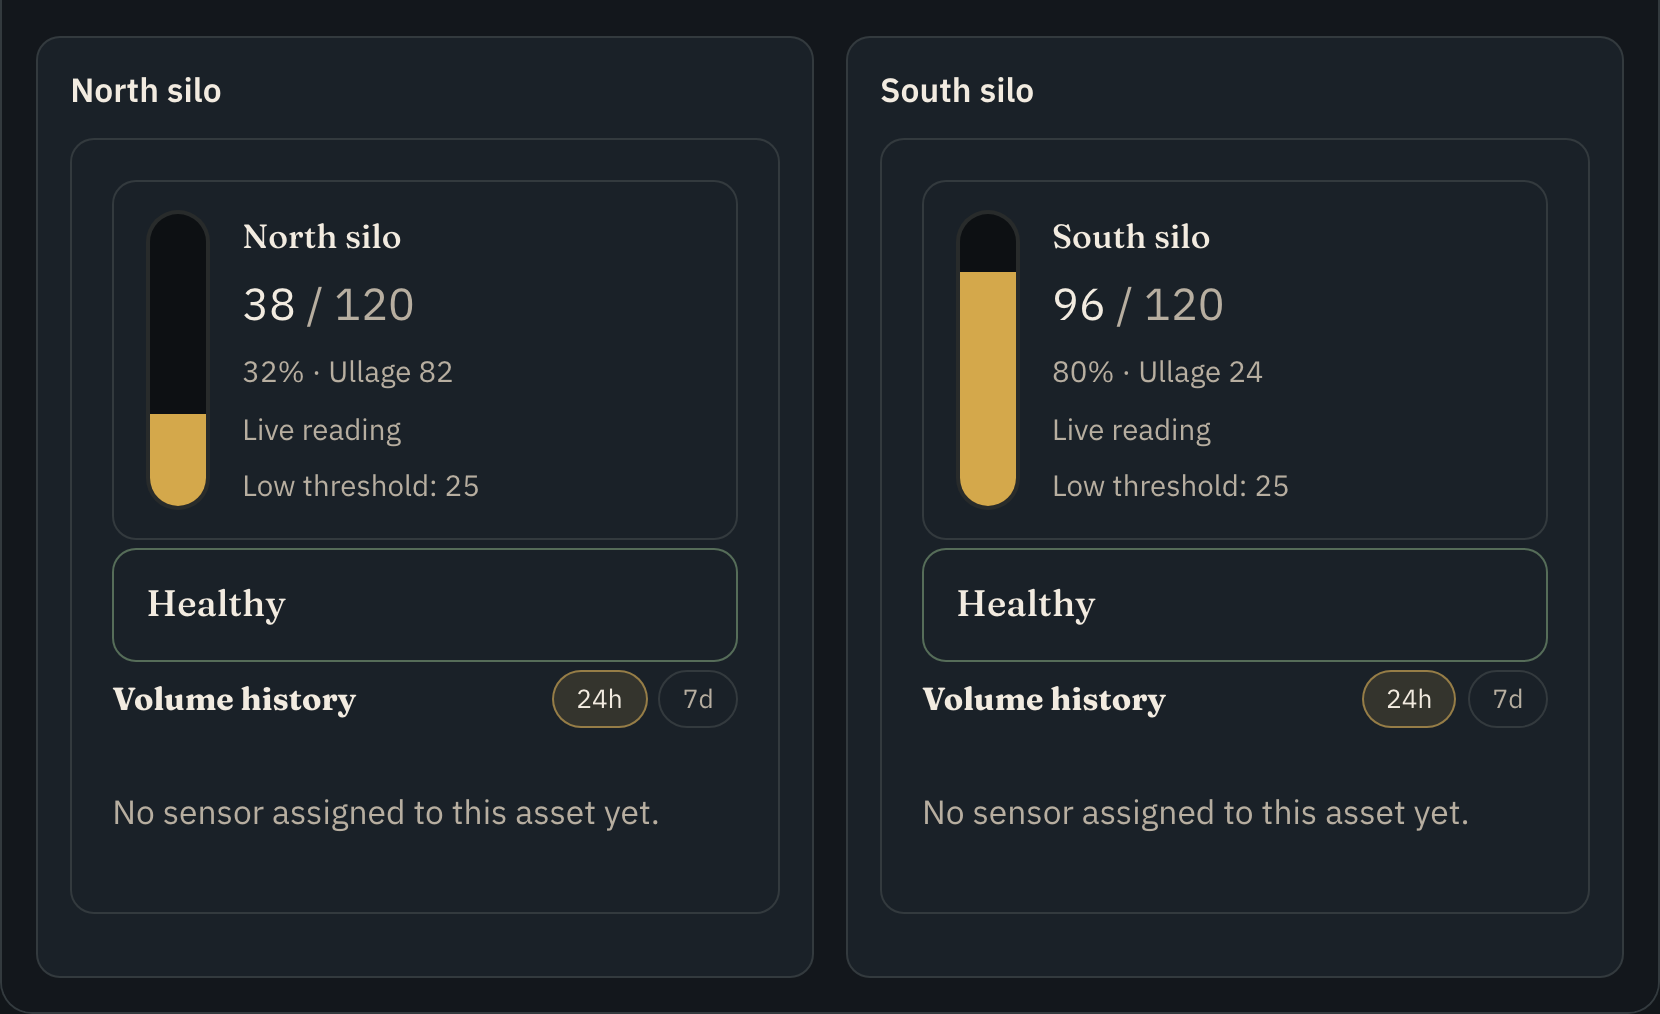
The sections below show the JSON that produces that workplace, with the same example widgets used to illustrate the composition.
What composition owns #
| Layer | Responsibility |
|---|---|
| Product Application models and fields | Capacity, thresholds, device bindings, camera binding |
semantic_composition on the published definition | Facets, relations, rollups, terminology, event streams |
Portal pages (page_type + config) | Which facets and overlays appear on a workplace page |
| Portal page data API | Records, resolved facet payloads, and windowed overlay events |
Composition does not auto-pair devices from a network. A silo record binds its level device and optional camera_device. The network remains the availability pool; the record is the pairing surface.
Where the contract lives #
| Stage | Location |
|---|---|
| Draft / OEM authoring | Product Application metadata (semantic_composition) |
| Published | ProductVersion.definition_json.semantic_composition |
| Portal instance payload | semantic_composition on the Product Instance response |
| Page data | GET /api/portal/products/{id}/pages/{page_key}/data/ |
Kits ship a starting composition (for example silo_level). After a kit upgrade that adds fields or facets, republish the Product Application version and refresh attached portal instances so existing records pick up the new contract.
Facets #
Each facet maps one record model onto one semantic component:
json
{
  "facet_key": "silo_level_timeseries",
  "component": "timeseries",
  "record_model": "@model:silo",
  "sort_order": 15,
  "bindings": {
    "value": { "source": "stream_derived", "key": "current_volume" },
    "unit": { "source": "field", "key": "units" },
    "band_ll": { "source": "field", "key": "low_low_threshold" },
    "band_l": { "source": "field", "key": "low_threshold" },
    "band_h": { "source": "field", "key": "high_threshold" },
    "band_hh": { "source": "field", "key": "high_high_threshold" },
    "device_online": { "source": "device_presence", "device_field": "device" }
  },
  "freshness": {
    "telemetry_stale_after_seconds": 300
  }
}Binding sources #
| Source | Resolves from |
|---|---|
field | Product record field |
stream_derived | Stream-derived field on the record |
stream | Live Device Class channel sample |
device_presence | Online/offline for a bound device field |
offline_sync | Offline dataset sync row |
constant | Static display default |
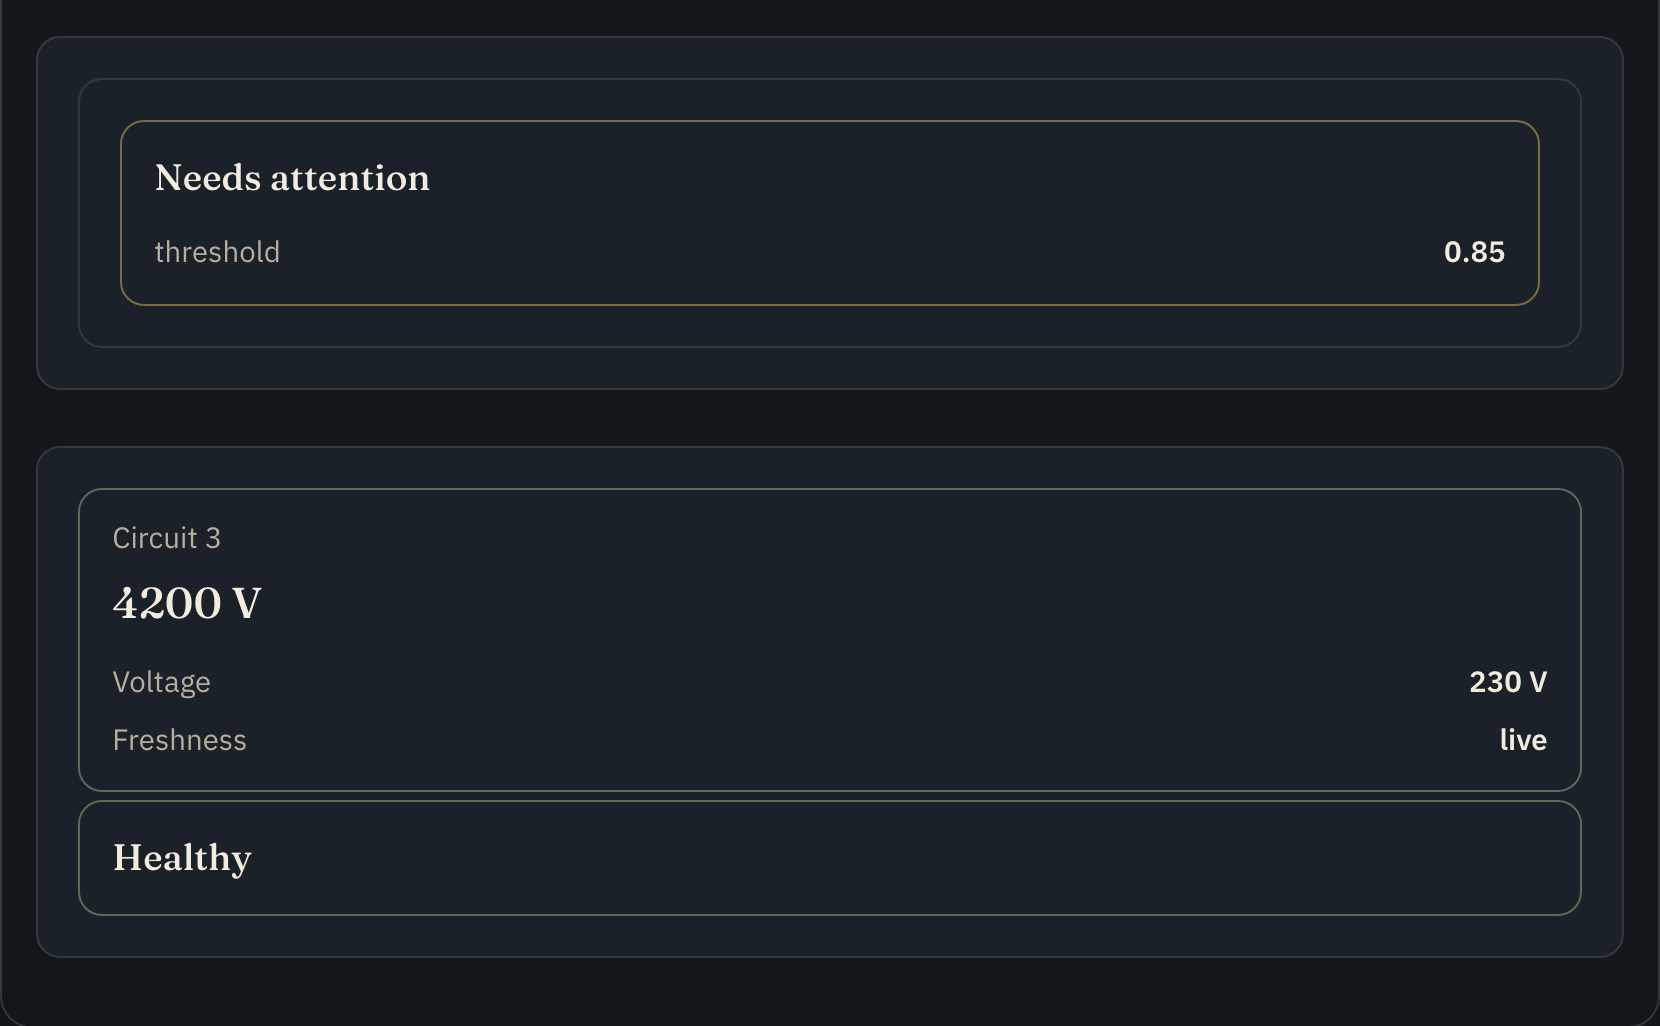
Every facet must render explicit freshness (live, stale, offline, unknown) rather than presenting a last-known value as current truth. See Device data and control contract.
Current fill vs volume history #
These are different operator jobs. Do not reuse one label for both.
| Facet component | Operator job |
|---|---|
level_capacity | Snapshot: quantity vs capacity and threshold attention now |
timeseries | History chart: series over a window with HH/H/L/LL bands and markers |
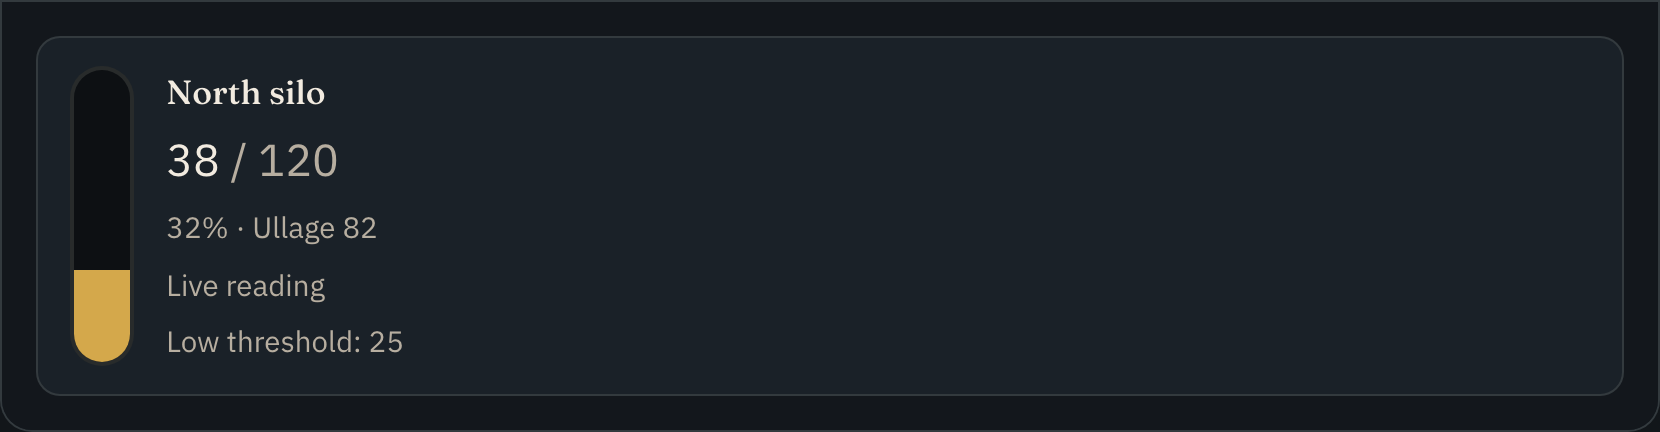
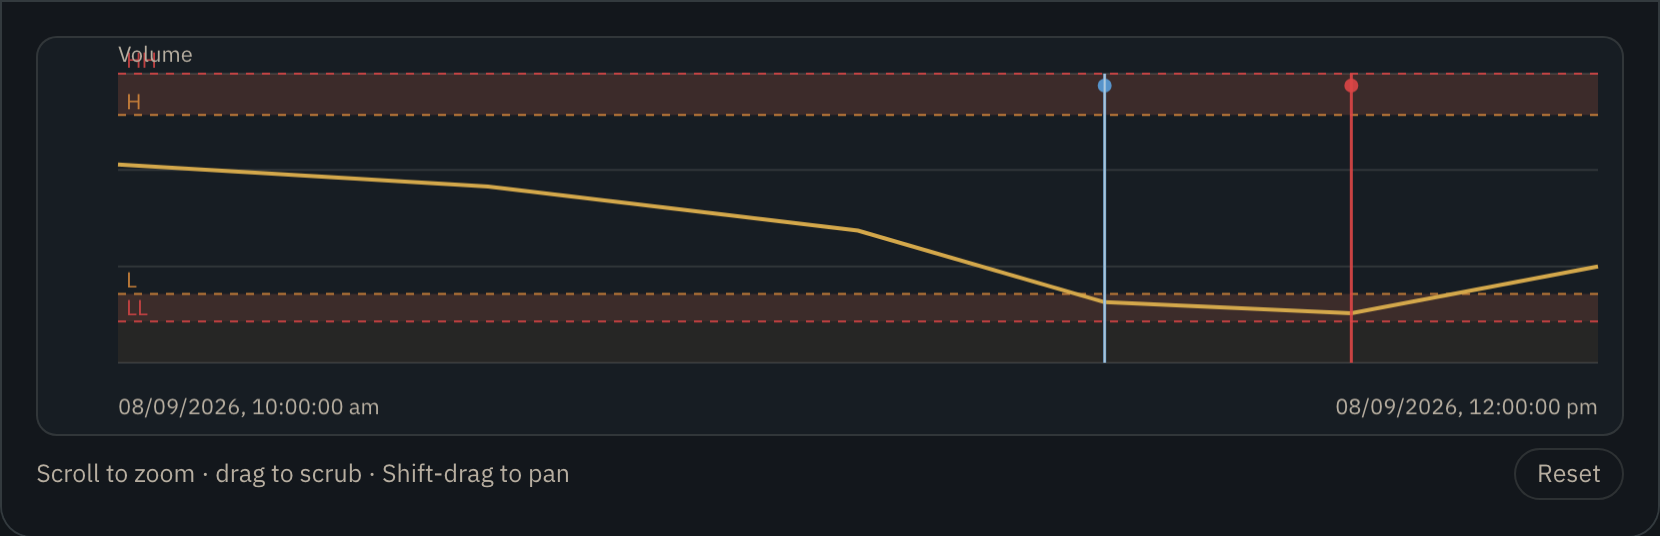
In silo monitoring the capacity page shows current fill and a separate volume history chart in the same record stack.
Page archetypes #
Composition page types used by first-class apps:
page_type | Use it for |
|---|---|
capacity | Grid of vessels/meters with facet stacks and shared overlays |
board | Lane board for work-in-progress records |
timeline | Chronological event / setpoint / playback history |
ledger | Append-oriented tabular history |
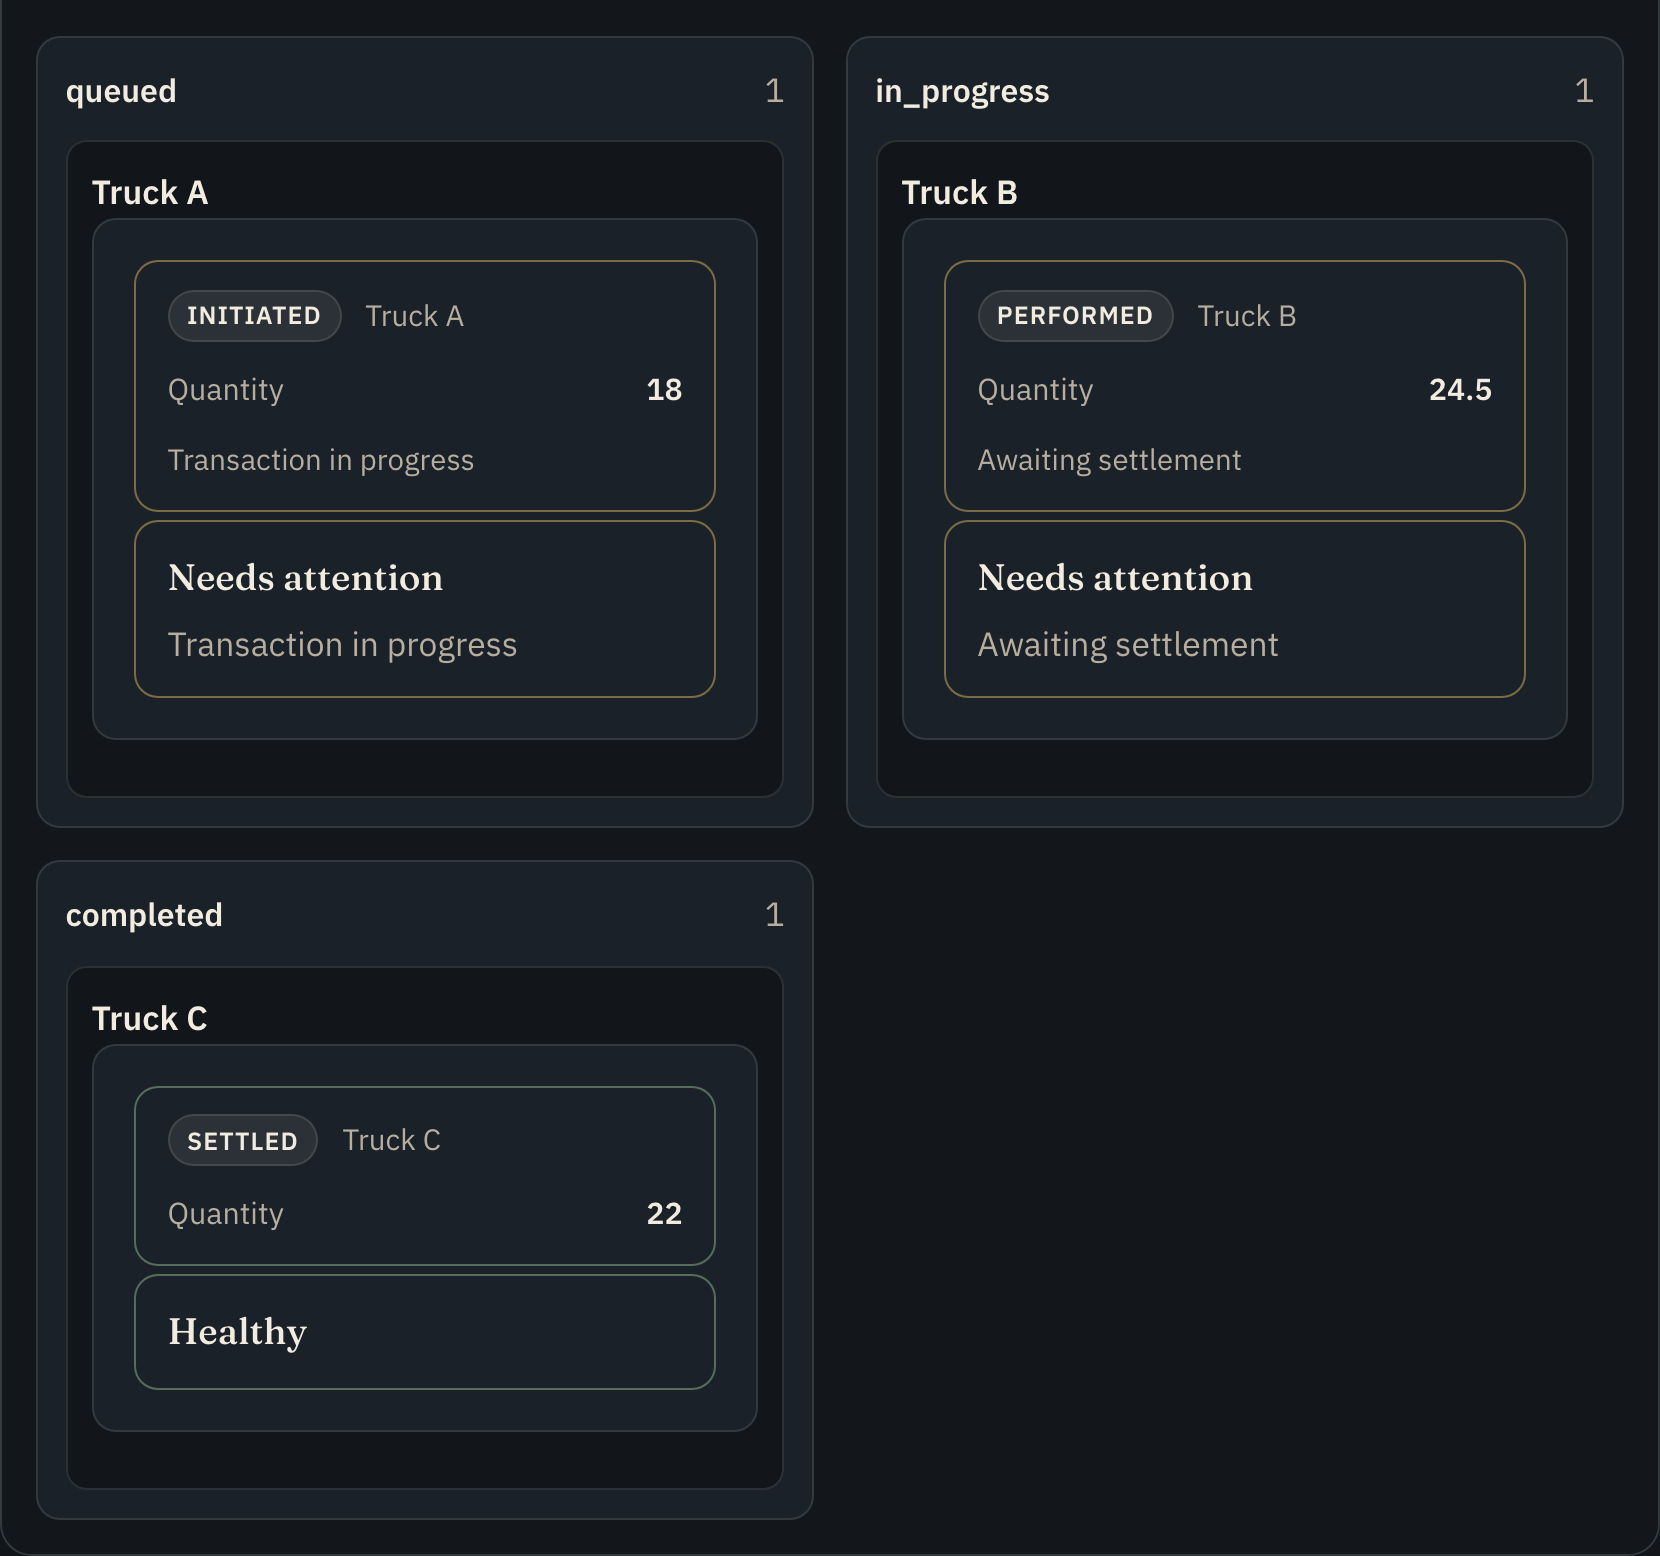
Workspace pages such as Overview, Work, Exceptions, Records, and Map remain available through Application Workspace presentation. Composition archetypes sit alongside those pages when the product needs a semantic workplace (for example Silo capacity).
Capacity page config #
json
{
  "key": "silo-capacity",
  "page_type": "capacity",
  "model_logical_key": "silo",
  "config": {
    "title": "Silo capacity",
    "primary_model": "@model:silo",
    "facet_keys": [
      "silo_level_capacity",
      "silo_level_timeseries",
      "silo_watch_camera"
    ],
    "overlay_event_keys": [
      "silo_band_alerts",
      "silo_band_crossings"
    ],
    "timeseries": {
      "series_field": "current_volume",
      "unit_field": "units",
      "bands": {
        "ll": "low_low_threshold",
        "l": "low_threshold",
        "h": "high_threshold",
        "hh": "high_high_threshold"
      },
      "window": "24h"
    }
  }
}overlay_event_keys selects which composition event_streams feed the page. timeseries.window accepts values such as 24h or 7d and drives the default event query window on the page data API.
Event streams and shared overlays #
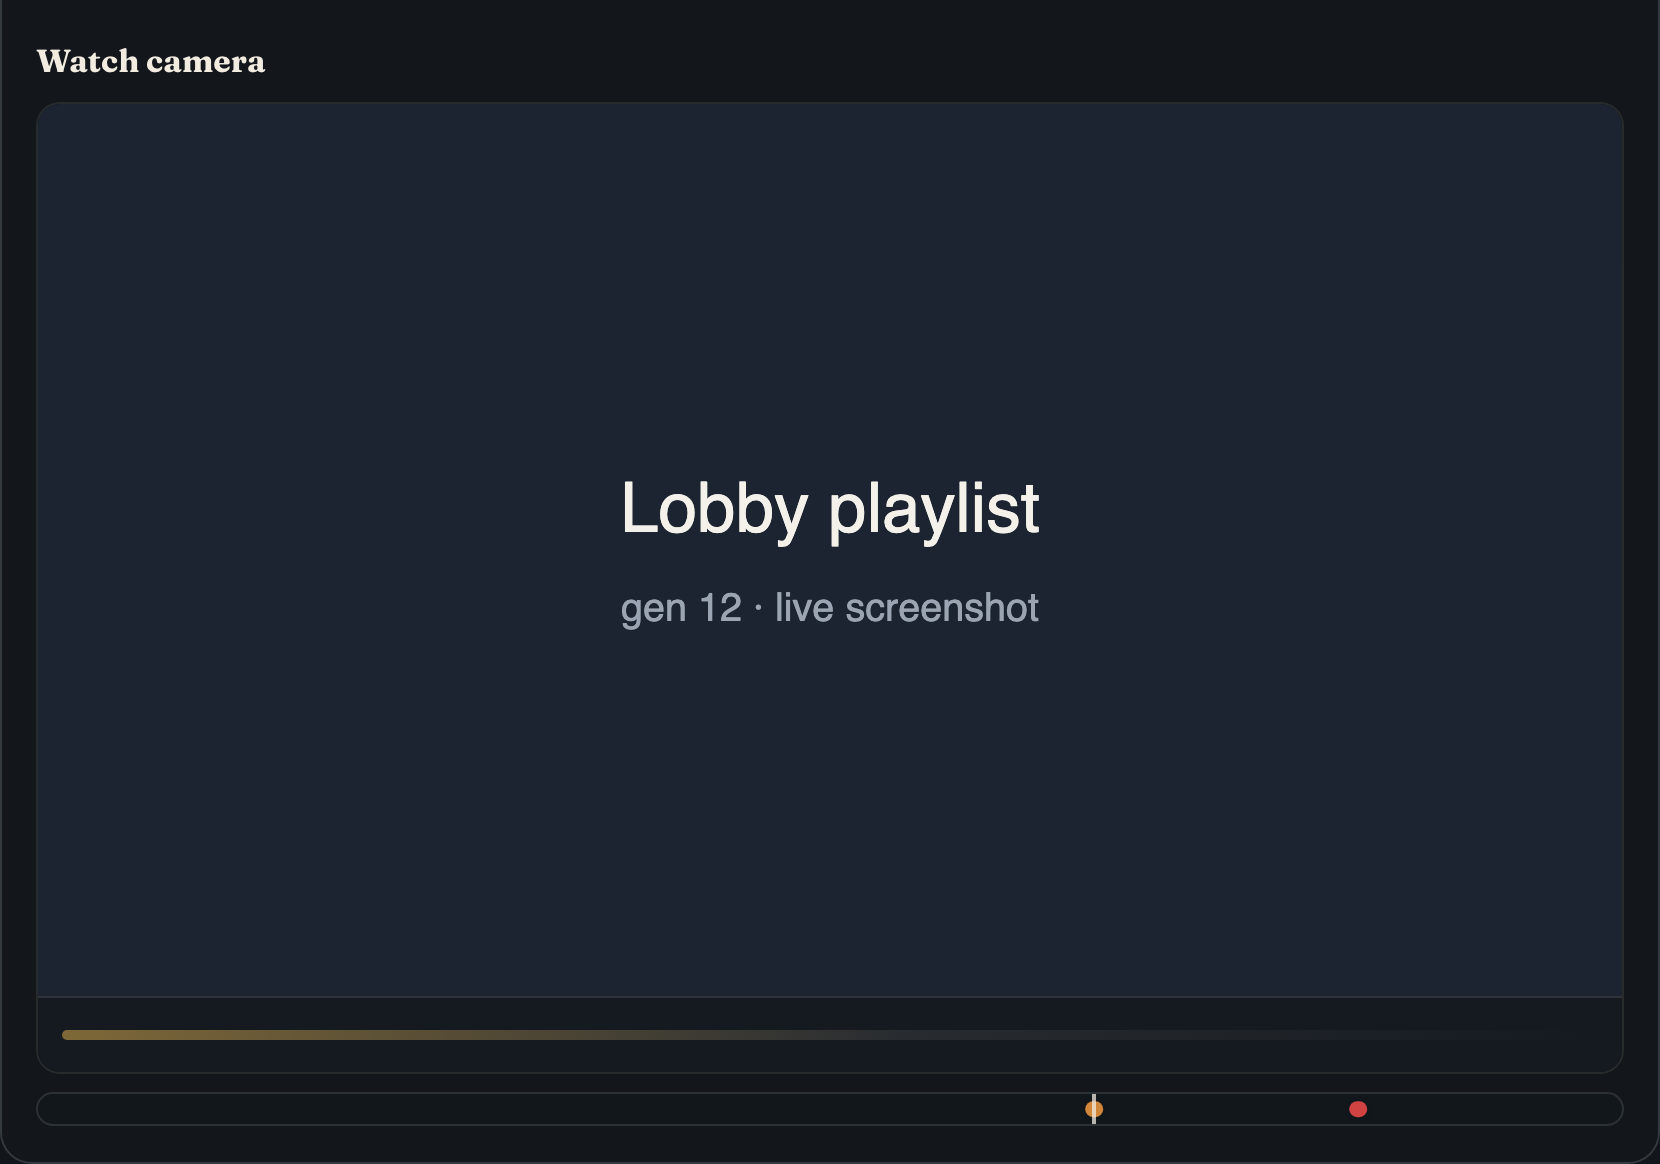
Declare streams once on the composition. Hosts that share a record (volume history chart and watch camera) consume the same normalized overlay points so markers align on one time axis.
json
"event_streams": [
  {
    "stream_key": "silo_band_alerts",
    "kind": "alarm",
    "source": "product_alerts",
    "alert_keys": [
      "silo_low_low",
      "silo_low",
      "silo_high",
      "silo_high_high"
    ]
  },
  {
    "stream_key": "silo_band_crossings",
    "kind": "threshold",
    "source": "band_crossings",
    "series_field": "current_volume",
    "bands": {
      "ll": "low_low_threshold",
      "l": "low_threshold",
      "h": "high_threshold",
      "hh": "high_high_threshold"
    }
  },
  {
    "stream_key": "silo_camera_motion",
    "kind": "motion",
    "source": "device_channel",
    "device_field": "camera_device",
    "channel": "motion"
  }
]
Stream sources #
source | Producer | Notes |
|---|---|---|
product_alerts | Portal page data (events) | Open alerts plus recently resolved alerts in the window; filtered by alert_keys when set |
band_crossings | Client from series + band fields | Threshold crossings derived from the chart series |
device_channel | Client / device channel | For example camera motion on camera_device |
record_events | Reserved | Application-specific record timeline events |
Overlay event point shape #
Normalized points returned on page data (and mirrored by the portal semantic package) look like:
json
{
  "t": "2026-09-08T01:10:00.000Z",
  "t_end": "2026-09-08T01:25:00.000Z",
  "kind": "alarm",
  "severity": "warning",
  "label": "Low level",
  "source_ref": "silo_low",
  "record_id": "rec_…",
  "stream_key": "silo_band_alerts",
  "status": "open",
  "band": "l"
}record_id scopes markers to one silo (or other record). Alerts that omit a record id are not treated as network-wide overlays for every vessel.
Portal page data API #
http
GET /api/portal/products/{product_id}/pages/{page_key}/data/Useful query parameters for capacity / timeseries pages:
| Parameter | Purpose |
|---|---|
window | Relative window (24h, 7d); defaults from page timeseries.window |
since / until | Absolute ISO bounds when you need an exact range |
The payload includes page records, facet-ready values, and an events array of overlay points for the selected streams. The portal composition stack provides those events to timeseries and media hosts so the chart and camera scrubber stay aligned.
Operator model for silo monitoring #
- Place level and camera devices on a network (yard).
- Create or edit a silo record: bind
device(level), optionallycamera_device, capacity, and LL/L/H/HH thresholds. - Open the Silo capacity workplace: current fill, volume history with bands and alarm markers, and watch camera with the same marker rail when a camera is bound.
Publish a new Product Version after kit changes that introduce timeseries, event_streams, or new threshold fields. Existing instances keep the older published definition until you roll them forward.