

Appearance
Build a customer-operated level monitor #
A level sensor becomes much more interesting when a customer can open a portal, see the latest reading, change a threshold, and watch an alert appear.
This workshop takes you through that whole journey. The example is a fictional grain product called SiloSentry Monitor, but the same pattern works for a tank, bin, well, battery, or any other bounded quantity.


Where operators use it #
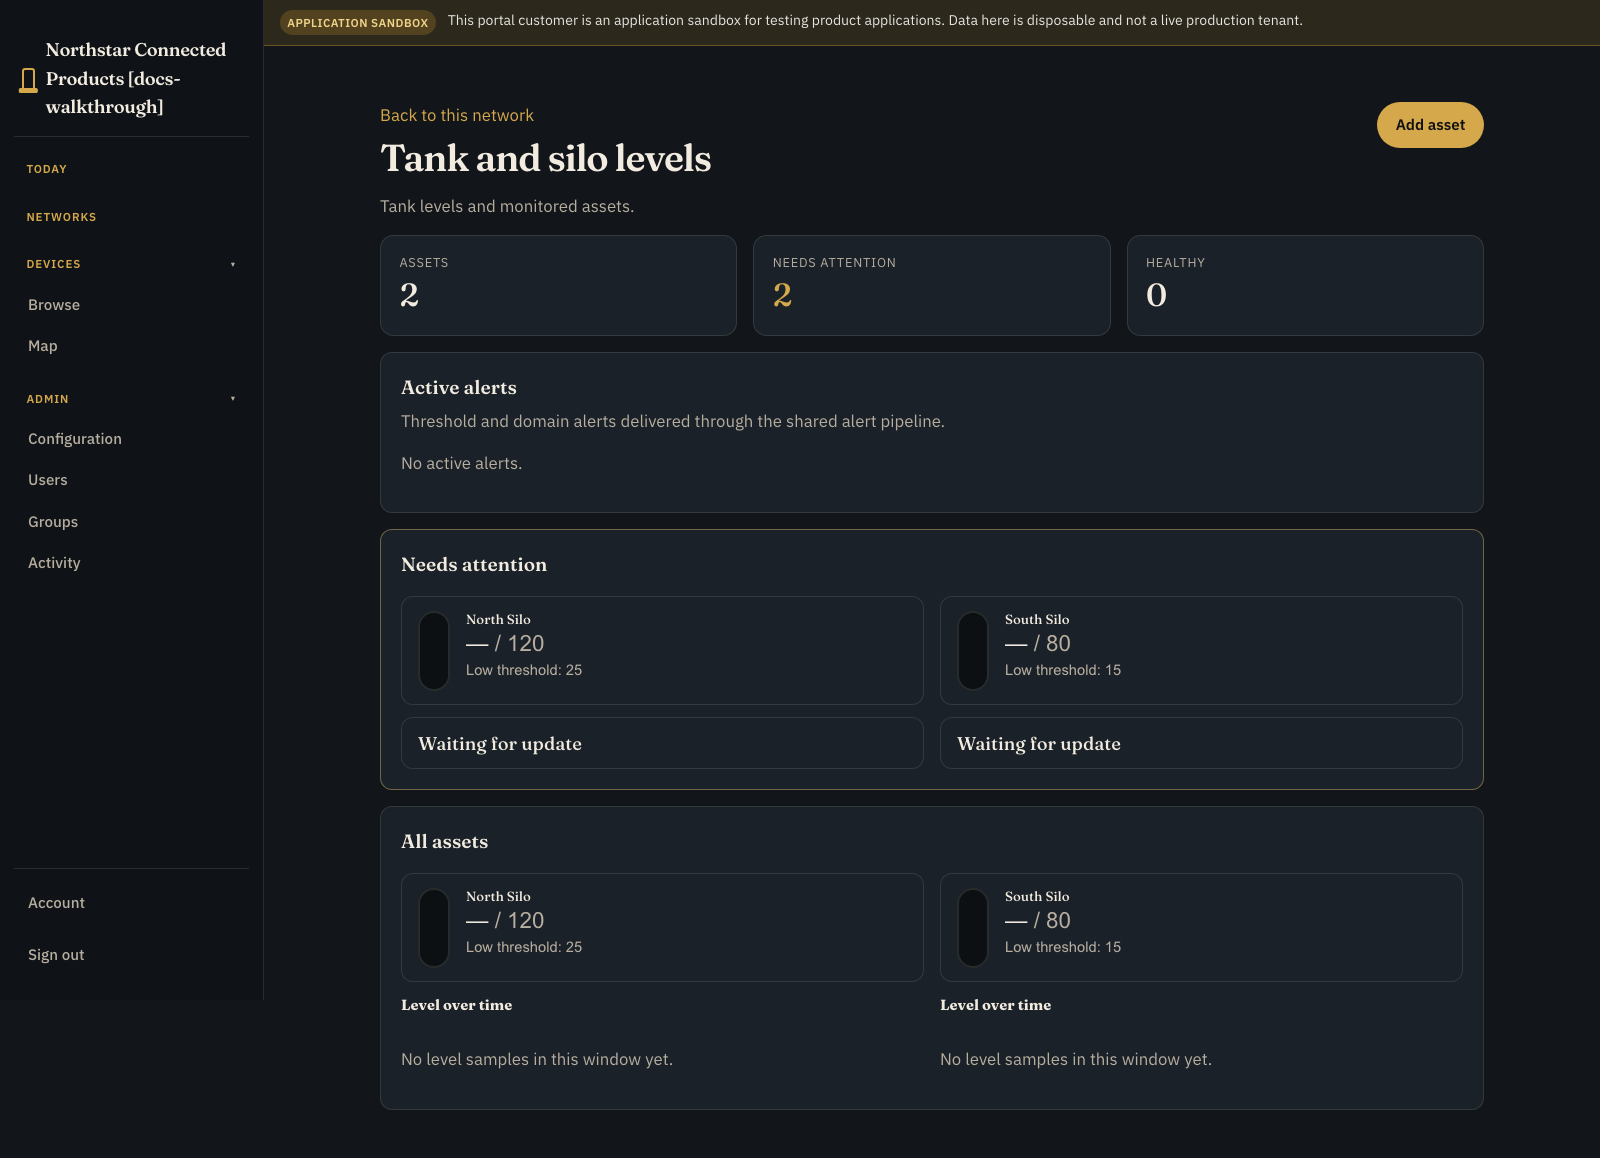
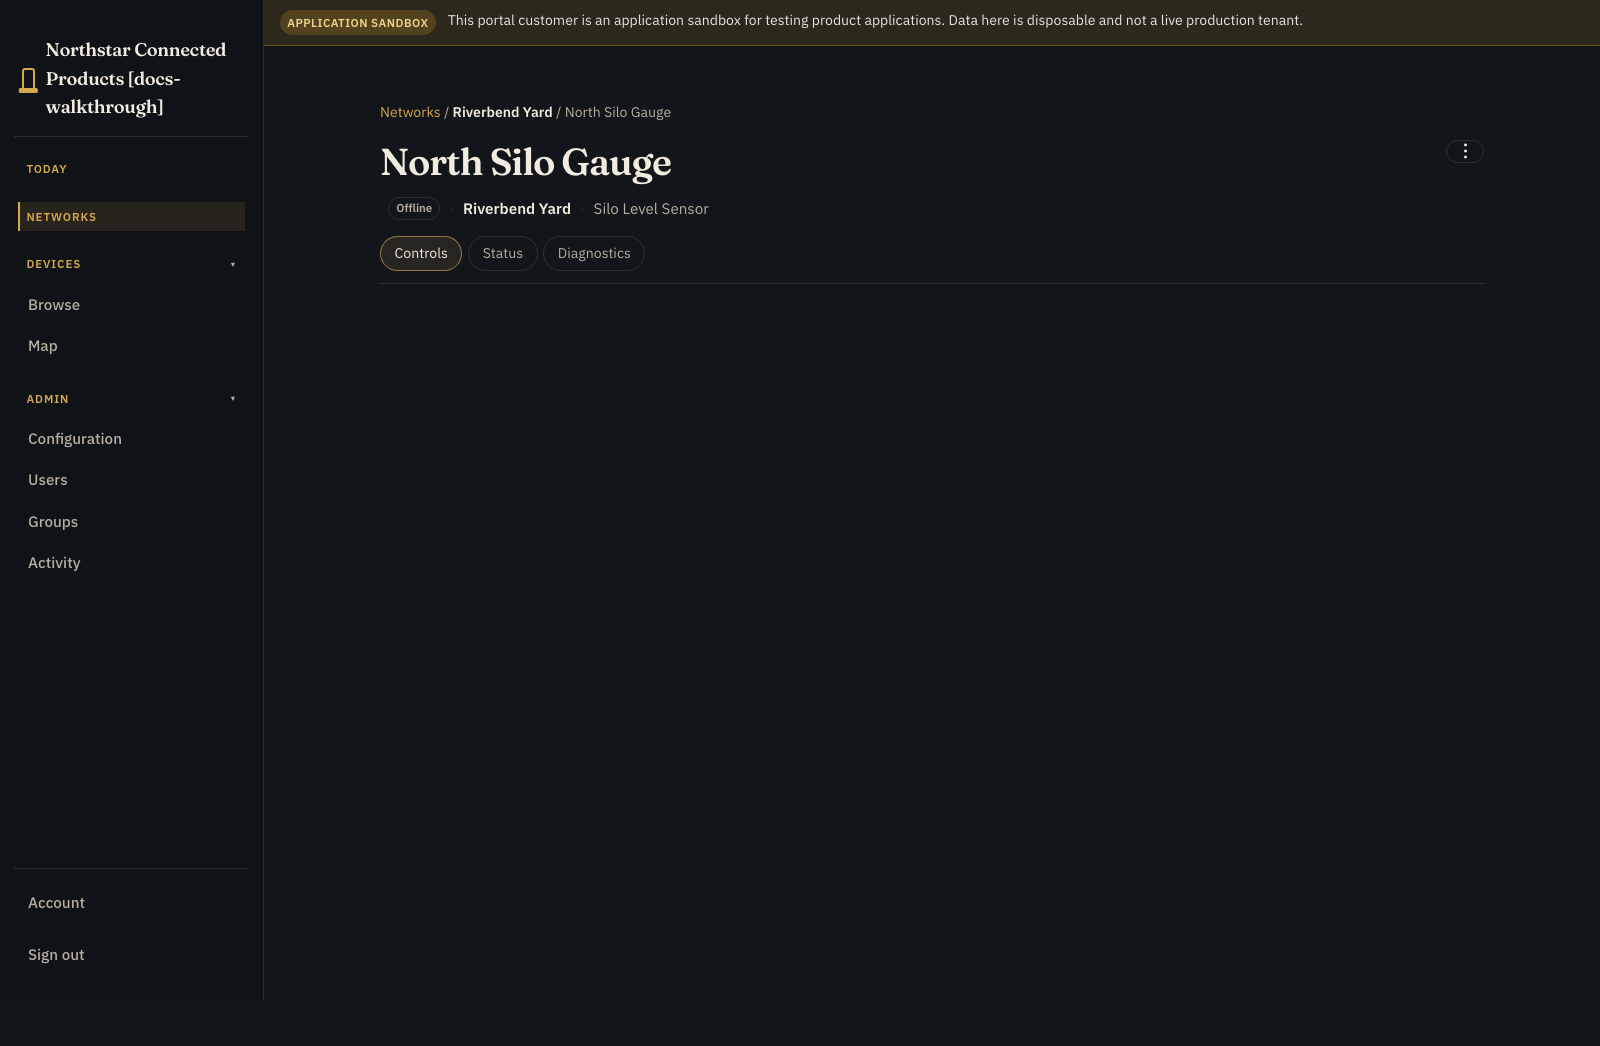
Open the yard from Networks, then open the silo workplace. The kit publishes a capacity composition page (silo-capacity) that stacks the shared semantic facets for each silo record: current fill, volume history (with band guides and alarm overlays when streams are live), and optional watch camera. Open an enabled sensor and use Controls for this silo's level and vendor controls. The yard network is still the entry point for placement and site-wide work.
What this tutorial actually does
You can run the complete Dataplicity path with a simulator: stream transport, customer records, threshold operation, rule, alert, and portal. The simulator does not prove sensor accuracy, vessel calibration, or a physical filling outcome. Those remain part of your hardware product and field qualification.
By the end you will have a reusable Device Class, one representative device, a customer-facing level page, and a Silo Product Application that combines customer thresholds with the latest reading.
What you need #
- a supported Linux device with the Dataplicity agent
- a level sensor or staging simulator
- access to Engineering > Device classes
- access to Engineering > Software > Containers and I/O, and the class UI Designer
- access to Customer journey > Customer Portal and Customers
- a separate customer email address for portal testing
If the sensor is not ready, use grain-silo-sim, tank-level-sim, or water-table-sim. You can prove the product journey today and swap in the real adapter later.
1. Prove the measurement locally #
Before adding the cloud, make your Linux application read the sensor repeatedly. Write down:
| Decision | Example |
|---|---|
| Raw measurement | 4.2 m from the sensor datum |
| Cadence | Every 30 seconds |
| Plausible range | 0 m to 12 m |
| Missing-reading behaviour | Keep the last value only for a defined stale window |
| Calibration source | Empty/full points or an approved strapping table |
| Customer quantity | Height, percentage, volume, voltage, or pressure |
Keep the raw measurement. A cylindrical tank may have a simple conversion, but an irregular silo can need a strapping artefact and a well may use an inverted scale. Raw data helps support distinguish sensor trouble from conversion trouble.
2. Create the level-monitor Device Class #
- Open Engineering > Device classes.
- Choose New device class.
- Name it
SiloSentry Monitor. - Select the architecture of your representative device.
- Describe the supported sensor and runtime.
- Create the class.
A Device Class is the reusable product definition. It brings together hardware compatibility, software, streams, controls, settings, level conversion, and the customer layout.
Fast path: attach a simulator #
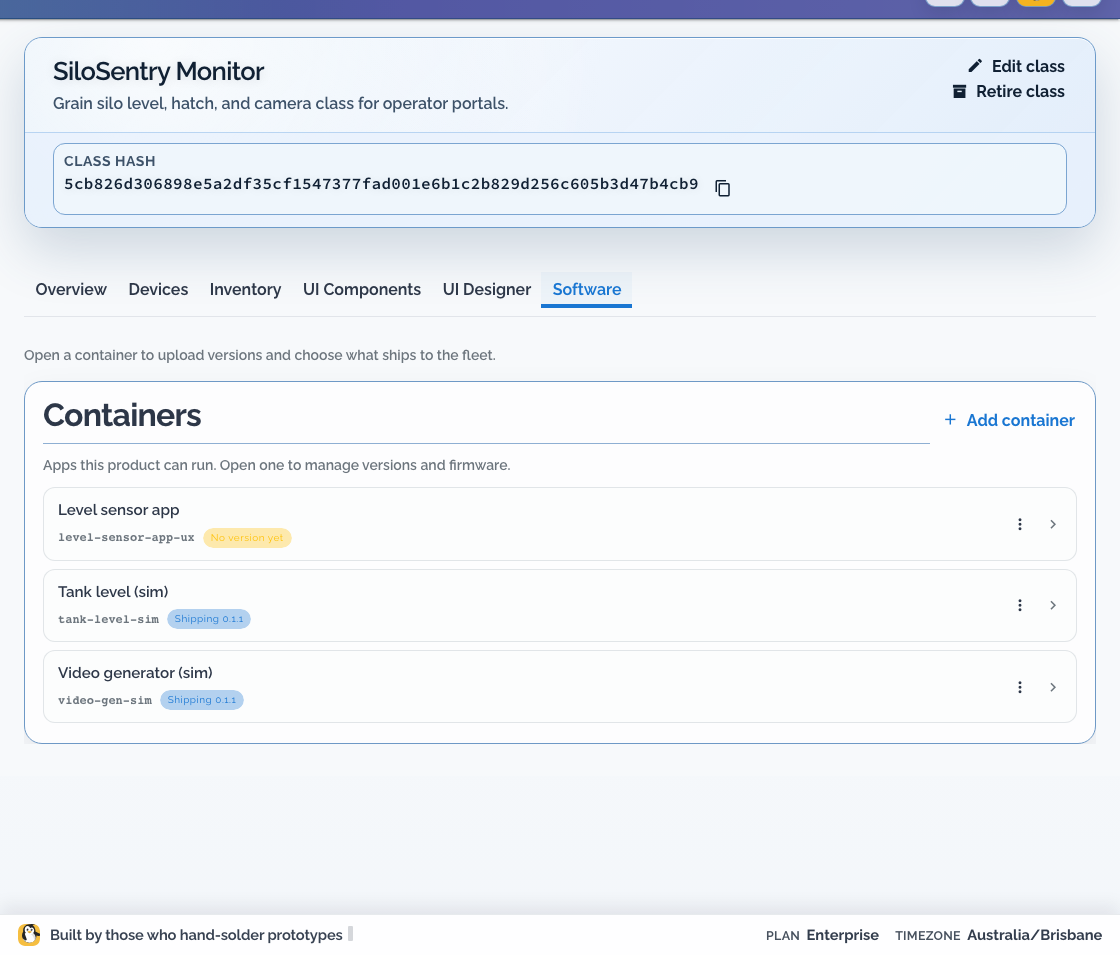
Open Engineering > Software > Containers, select the Device Class, choose Add container, and select Grain silo (sim), Tank level (sim), or Water table (sim). Add the example and assign the current Software Build to a tagged staging cohort or select it as the class default.
The example publishes bounded synthetic values through the local agent broker. When the hardware adapter is ready, keep the stable stream IDs and replace only the generator.
Bring your own runtime #
Your sensor application can remain a systemd service, Docker workload, or another supervised process. Create a stream under Engineering > Software > I/O:
| Field | Value |
|---|---|
| ID | silo_height_m |
| Name | Silo fill height |
| Data type | Number |
| Unit | m |
| History | Enabled for the customer decision window |
Publish a sample to the local broker:
text
POST http://127.0.0.1:18765/v1/streams/silo_height_mjson
{
  "sequence": 1,
  "timestamp_ms": 1710000000000,
  "body": { "value": 4.2 },
  "metadata": { "source": "level-adapter" }
}The publisher needs no Dataplicity API key. The local agent authenticates and delivers the sample.
3. Describe the product behaviour #
Under Engineering > Software > I/O, add only the things your customer and support team need:
| Product idea | Example |
|---|---|
| Raw value | silo_height_m numeric stream |
| Warning state | silo_below_low and silo_above_high booleans |
| One-off action | Run sensor test |
| Persistent setting | Reporting interval with safe bounds |
| Customer quantity | Level input using height, capacity, and calibration |
Choose the level shape that matches the product: silo, tank, compact tank, battery, wellhead, percentage gauge, or absolute gauge.
Do not turn height into “volume” by changing the label. If the conversion needs a strapping table, configure one or show that calibration is incomplete.
An action asks the device to do something now. A setting records desired state. Your device application must validate, apply, and report both safely.
4. Connect the representative device #
- Open Engineering > Devices.
- Choose Add device and select SiloSentry Monitor.
- Copy the current class-specific installer command.
- Run it on the Linux device.
- Wait for the device to become Online.
- Check that the publisher or simulator is running.
- Watch the raw stream change at the expected cadence.
- Compare one sample with a trusted local reading.
Treat the installer command as a secret. Keep it out of source control, screenshots, and support tickets.
Test minimum, normal, and maximum staging values before designing the page around the middle of the range.
5. Design the customer level page #
Open UI Designer and arrange the page in decision order:
- product name, site, serial number, and connectivity
- current level, unit, and freshness
- low, normal, or high state
- history over the period used for filling decisions
- the bounded sensor-test action
- reporting preference and support context
Preview with the staging device. Try missing, stale, offline, uncalibrated, low, normal, high, and out-of-range states. Also check that a viewer sees no controls.
6. Create the first customer and location #
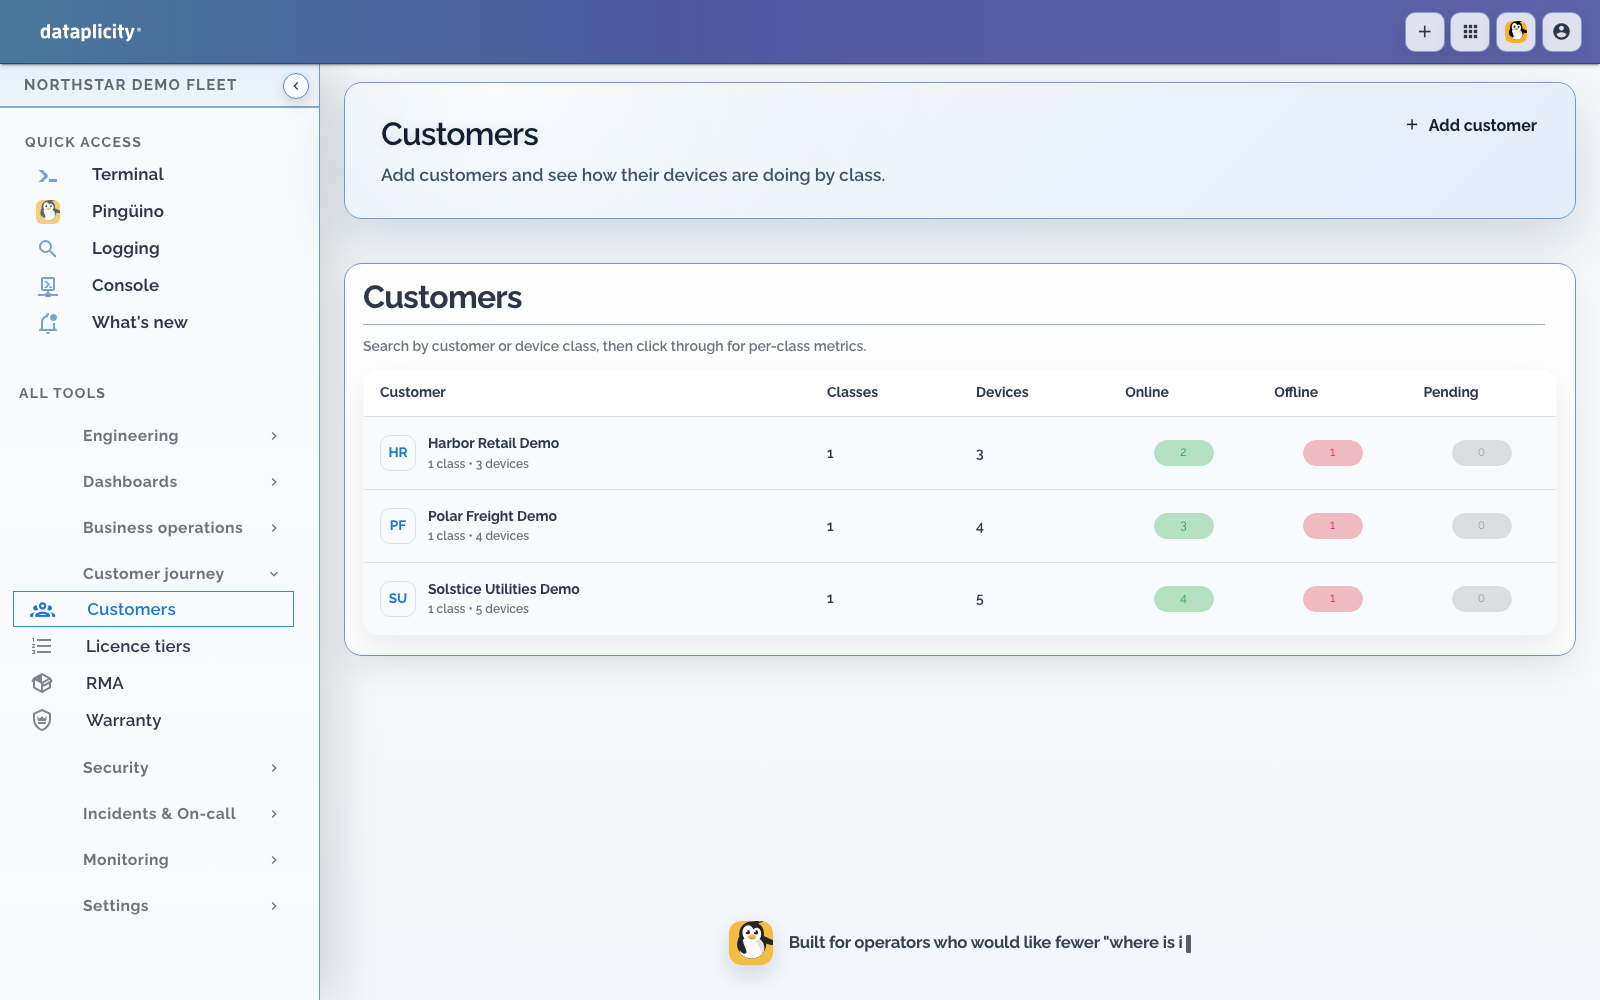
Open Customer journey > Customer Portal and check the portal name, branding, and support route. Then open Customers, create the downstream customer, and invite an administrator plus a read-only test user.
In the Customer Portal, create a network such as Riverbend Yard. Here a network is the placement boundary for products; it can represent a farm, building, vehicle, or cabinet.
7. Allocate the monitor #
Return to Engineering > Devices, choose the verified monitor, and allocate it to the customer. Sign in as the customer administrator, open Devices, and place the Ready monitor in Riverbend Yard. Network placement makes it Enabled and eligible for the yard-level silo workplace.

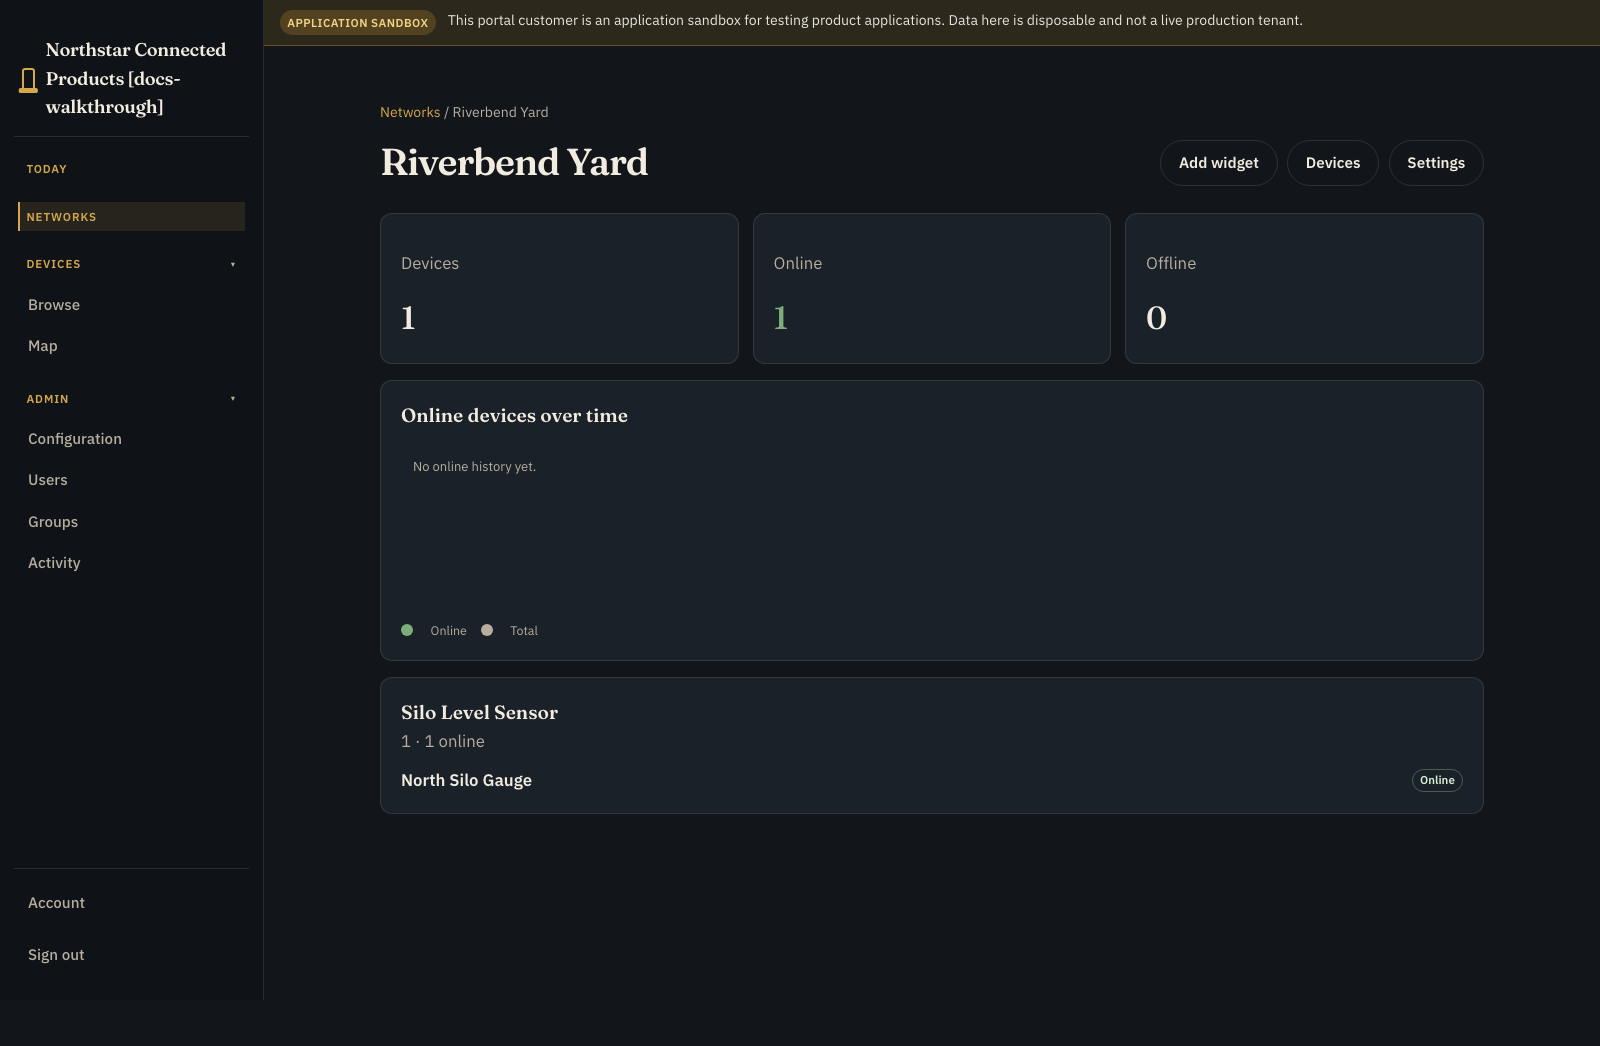
Allocation changes ownership. It does not install the agent, repair a sensor, or validate calibration, so complete those checks first.
8. Add the silo workflow #
Open Developer > Product Applications, create an empty application, then choose the shipped Silo monitoring starter and Use example. In the kit dialog, map its required sensor role to SiloSentry Monitor and apply the kit. The kit supplies the native recipe and baseline records below; review them rather than recreating a parallel application:
- a
silorecord containing capacity, LL/L/H/HH thresholds, sensordevice, optionalcamera_device, and a read-only height plus volume derived from the device stream strapping_rowrecords that map known heights to known volumes for that particular vessel- a customer operation for changing the low threshold
- rules that open alerts for low-low, low, high, and high-high band breaches
- semantic composition for current fill, volume history (bands + alarm markers), and optional watch camera with a shared event marker rail
- list and detail pages for the Customer Portal
Bind the level sensor and optional camera on each silo record. The yard network is the device pool; composition does not auto-pair cameras across the network. Authoring details for facets, event_streams, and capacity page overlays are in Semantic composition.

Publish an immutable version under Release, then use Attached portals to attach that version to the intended portal. Each customer tenant receives an isolated instance.


Publish the application, provision an instance for your test customer, and post a height reading between two calibration points. The proof uses 1,000 mm → 500 and 2,000 mm → 1,500; a 1,500 mm stream sample therefore resolves to volume 1,000 by piecewise-linear interpolation.

9. Let the customer change the threshold #
Open the Silo record and edit the low-volume threshold on that record. The first-class editor is the bounded configuration surface; the current product does not expose a separate “Set low threshold” operation form.
Reload the record and check that the stored threshold changed while the stream-derived height and volume stay read-only.
Test three roles before handover. A viewer should see readings and history but no controls. An operator should see only approved actions and bounded settings. An administrator should place the monitor only within the customer's networks. Then sign in as a second customer and confirm the monitor is absent.
10. Verify the customer product #
Repeat the key journey as each role. Viewer roles cannot act or change settings; operators can use only approved controls; administrators can manage placement. Confirm the current value, history, threshold, and alert all belong to the intended customer.
11. Replace the simulator #
When real hardware is ready:
- keep the stable stream, action, and setting IDs
- replace synthetic values with the tested sensor adapter
- preserve range checks, units, cadence, and stale behaviour
- build for the target architecture
- release to staging hardware
- compare raw and derived values with trusted local measurements
- verify both OEM and customer views before rollout
The portal cannot validate mounting, calibration, ingress protection, power recovery, or sensor replacement. Include those in your product release and field-service process.
Production handover gate #
- Compare raw sensor values with a trusted local measurement.
- Match calibration and capacity to the correct vessel.
- Distinguish missing, stale, uncalibrated, offline, and out-of-range states.
- Use honest units and precision.
- Bound and validate every device action and setting.
- Test power and network recovery.
- Check viewer, operator, and administrator roles.
- Prove another customer cannot see the monitor.
- Document replacement and recalibration.