System
The System Diagnostics tab comprises of three sections:
- CPU
- Memory (RAM)
- Disk
CPU
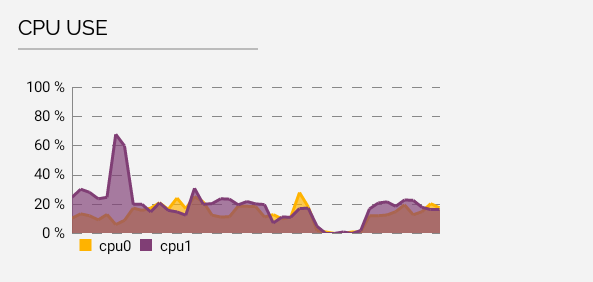
This section plots a simple chart monitoring CPU utilisation across each of your processor cores.

CPU
Although application specific, this chart is normally most interesting in the event that one or more of your cores is "red-lining" (ie running at 100%), which can indicate that some process on your device has gone wrong. It is also a convenient method to monitor the impact of your custom apps, scripts and/or services running on your device.
Memory (RAM)
The amount of Random Access Memory (RAM) currently in use.

RAM
Bearing in mind devices such as Raspberry Pi aren't as high powered as your laptop, you might find your RAM is running hot if you are running Chrome on your device with more than a few tabs open, for example.
Disk Usage
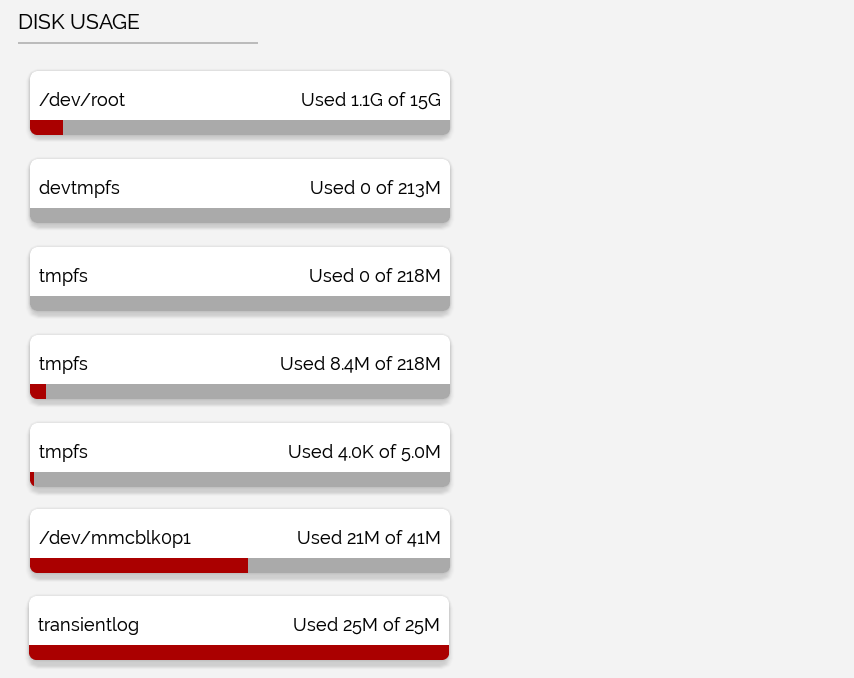
An overview of how much space is used by each file system mounted on your device.

Disk Usage
Not unlike your laptop, when your disks fill up you'll either have to delete some stuff or rearrange your partitions to create some space.
Updated 11 months ago
