

Appearance
Search logs #
Start with the smallest useful scope. Log search combines field tokens with remaining text, which is matched against log content.
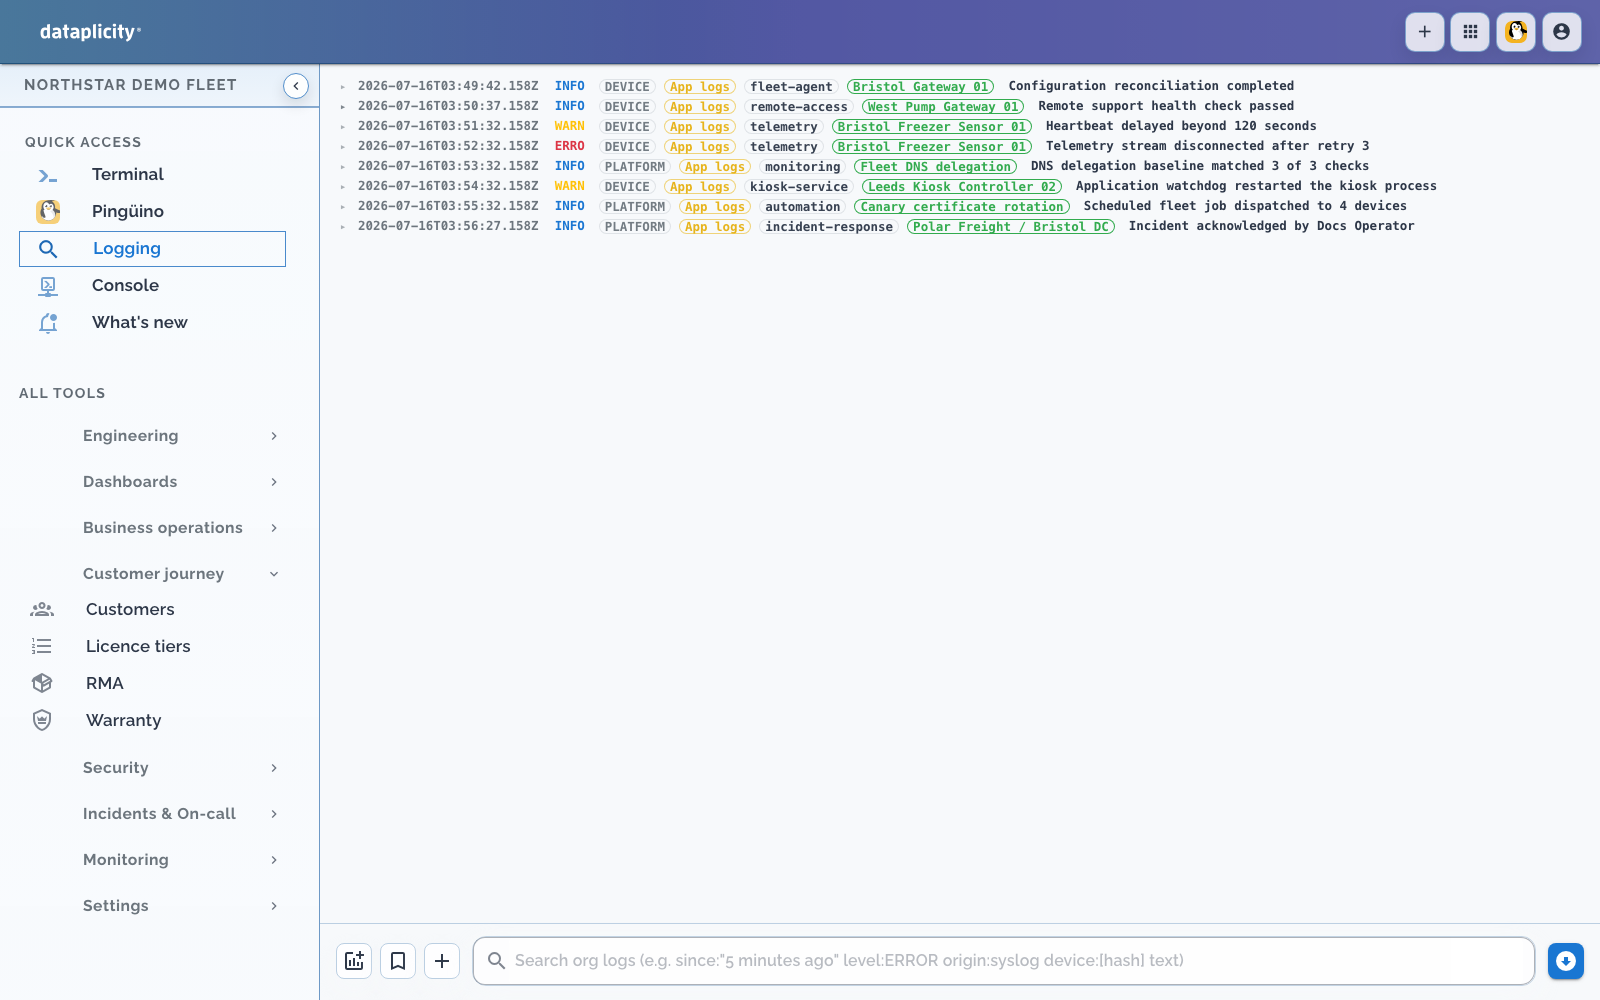
Supported filters #
| Token | Meaning | Example |
|---|---|---|
device: | Device hash | device:abc123 |
class: | Device-class hash | class:def456 |
app: | Application label | app:gateway |
origin: | Event origin | origin:agent |
type: | Classified source type | type:generic_syslog |
level: | Log level | level:ERROR |
since: | Start of time range | since:"15 minutes ago" |
Combine tokens with spaces:
text
device:abc123 app:gateway level:ERROR timeoutTokens are combined as restrictions. Remaining words are text search. Quote relative time expressions that contain spaces.
Investigation workflow #
- Open Logs from the alert, incident, or organisation navigation.
- Add
device:orclass:before searching generic words. - Set
since:to just before the first observed failure. - Add
type:,origin:,app:, orlevel:only when the field exists on representative rows. - Open context around a matching row to inspect preceding and following activity.
- Save or share the query only after removing secrets or customer data.
Recent results can update live. Older windows use archive queries where archive data is available. Crossing between those data paths can change result latency and pagination. A gap does not prove that nothing happened.
Log alert rules #
A log alert rule supports a narrower query subset than the interactive viewer. It can match level, application, origin, source type, and remaining text, then group by device, application, or origin and send a webhook subject to throttling.
Test the rule with representative records. Secure the webhook endpoint, handle duplicate delivery, and use grouping and throttle windows to control noise. Do not assume every viewer token is evaluated by a log alert rule.
Analytics and investigations #
Where enabled, log analytics summarises trends, error rates, noisy devices, applications, origins, source types, event types, anomalies, and security events. Treat rollups as directional evidence. Confirm a finding against matching log records because classification, freshness, and selected time windows can differ.
Where enabled, Log investigations preserve a query, time window, detector threads, expanded evidence, notes, and pins as a repeatable evidence trail. Record acknowledgement and resolution in the incident timeline. You can also save a scoped query and add its findings to that timeline.
Troubleshooting #
- No results: remove filters one at a time and verify the time window is retained.
- Wrong source type: inspect the raw origin, application, source, and event fields.
- Too many results: add device or class scope before adding more text.
- Earlier data outside the results: check the retention shown for the organisation and the archive boundary.
- Live updates stopped: reload the window and confirm the organisation still has log access and ingest capacity.