

Appearance
Dashboards and displays #
Dashboards combine organisation or network data sources with layouts and widgets. Use them for internal operational views such as fleet health, customer support context, or rollout progress.
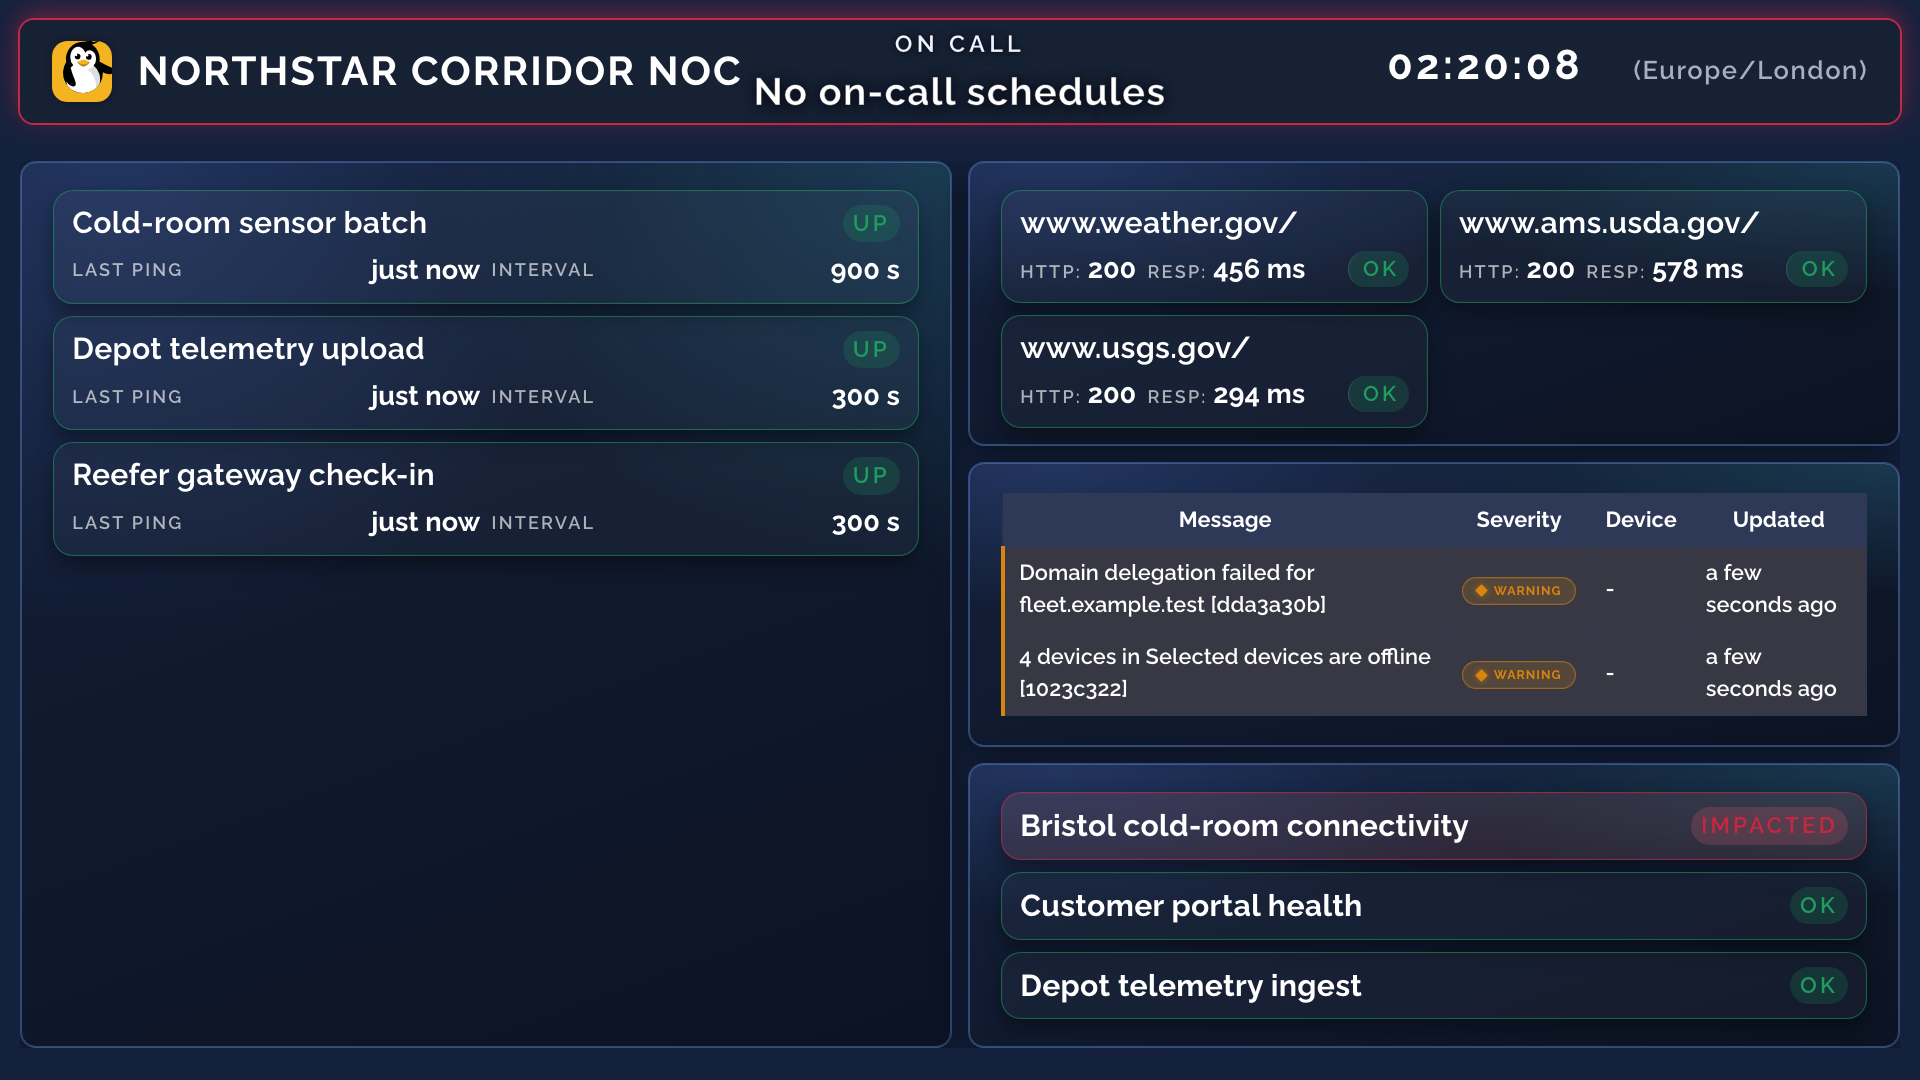
Design the layout for who walks past the screen, not for every metric you can chart. Northstar’s corridor NOC, Harbor’s brand partner TV, and Solstice’s contractor bay answer different daily questions - see Design the wallboard for who walks past it and Illustrative customers.
Build a dashboard #
- Define the data sources required by the view.
- Create a dashboard layout.
- Add the smallest set of widgets that answers one audience's questions.
- Configure variables and scope so a customer, network, or class selection cannot leak unrelated data.
- Preview with a read-only user and with missing or stale data.
- Publish only after checking units, time windows, and empty states.
A chart is not an alert. Add a monitor and response route for conditions that require action.
Troubleshoot data #
- Stale widget: inspect the source refresh time before changing the layout.
- Empty widget: verify source scope, variable value, permission, and retained data window.
- Different totals: compare time window, class, network, tag, and customer filters.
- Hidden edit controls: check dashboard-write access and effective organisation role.
Pair a shared display #
Dashboard displays support a paired TV or wallboard view.
- Create a display and select its content.
- Open the pairing view on the physical screen.
- Enter the short-lived pairing information in the management surface.
- Verify the screen shows only intended data.
- Revoke pairing when the screen is moved, replaced, or no longer trusted.
Treat a paired screen as a shared credential. Position it to avoid exposing customer, security, or personal data. Test fallback behaviour and network recovery before using it in a response centre.
Status pages and customer surfaces #
Use a public status page for selected service and incident communication. Use a hosted documentation site or support inbox only when the corresponding module is enabled for the organisation. These surfaces have separate access and publication boundaries from dashboards.