

Appearance
User-impact monitors #
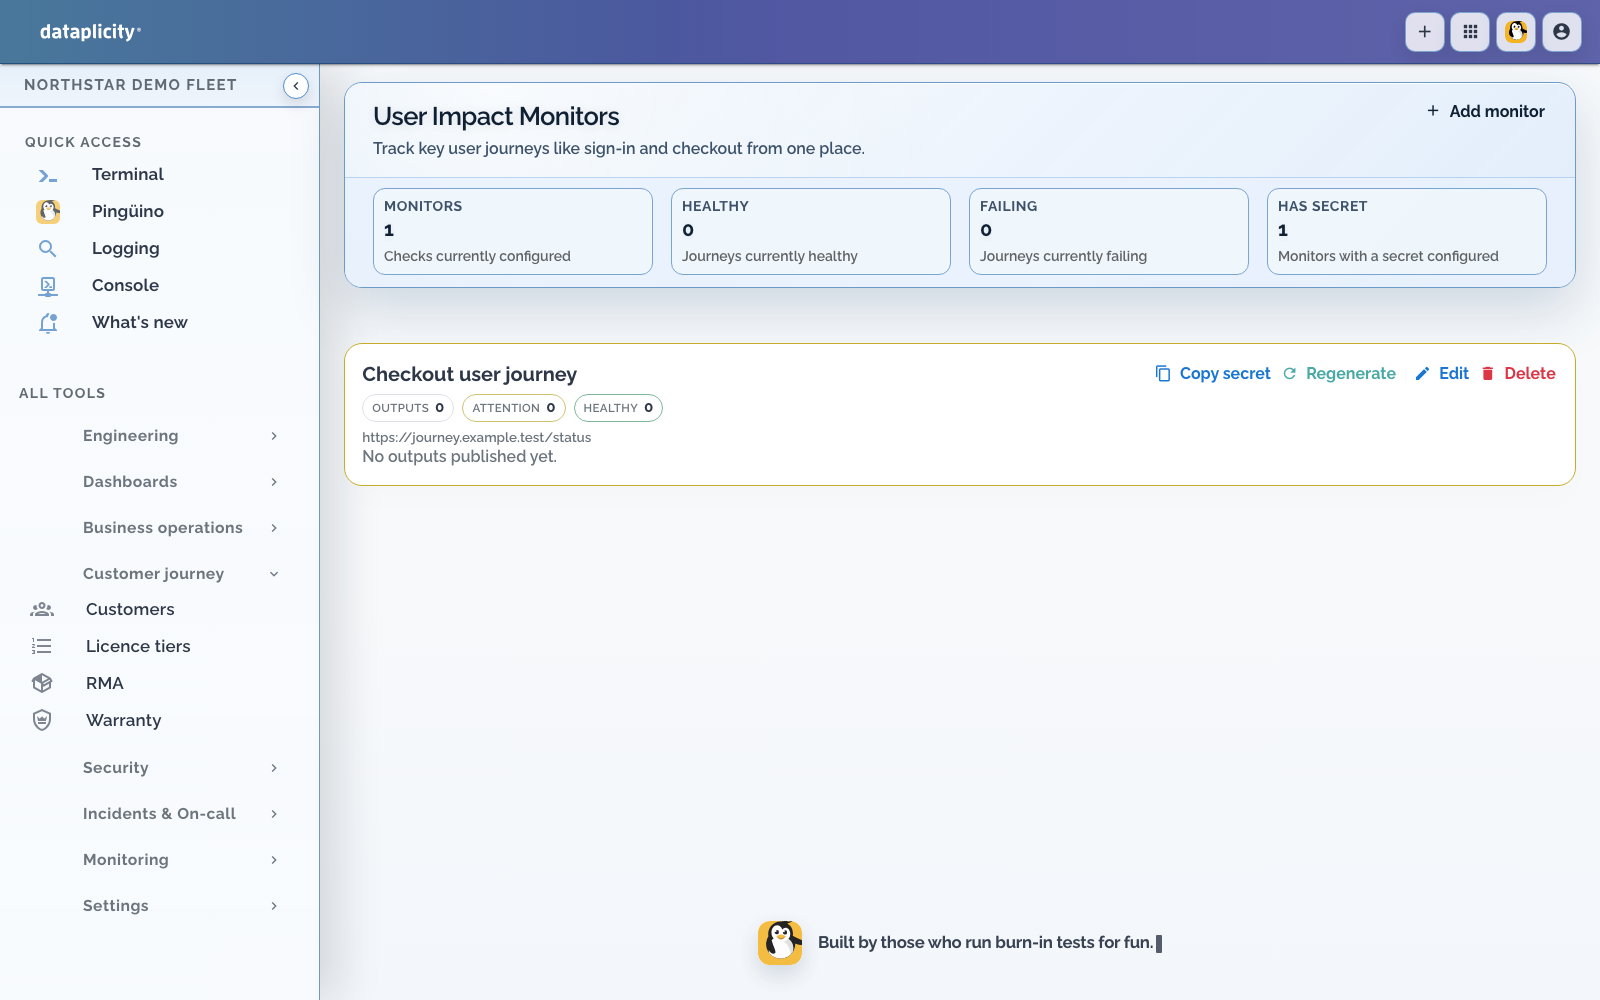
A user-impact monitor polls JSON produced by your application. It answers whether named customer journeys are working, which differs from an HTTP endpoint check that validates one response and from a device monitor that evaluates connectivity.
Use it when login, checkout, device control, data delivery, or another journey can fail while the health URL and devices remain online.
Prerequisites #
- an HTTPS endpoint reachable from Dataplicity
- a stable JSON response containing named flow statuses
- permission to manage monitors
- a plan for rotating the monitor secret
The monitor sends its generated secret when polling. Validate it at your endpoint and never log or publish it.
Report health #
Create a monitor, name it for the customer outcome, and enter the endpoint URL. Return each journey as a named flow with its current status. Metrics can include numeric values and thresholds for trend display.
Keep the producer deterministic. A response should reflect current journey evidence, not a long-lived cached success. Use stable flow names because status pages and responders learn those names.
After saving:
- confirm the first successful poll and timestamp
- force one test flow into an attention state
- verify aggregation reflects the degraded flow
- restore the producer and verify recovery
- add the monitor to a status page only after reviewing public labels
Interpret failures #
- A poll error means Dataplicity could not retrieve or accept the feed. It does not prove every customer journey failed.
- A failed flow means the producer reported that journey state.
- A metric threshold gives supporting context, not a substitute for a flow status.
- Stale results can indicate that polling stopped, the endpoint became unreachable, or the producer stopped refreshing evidence.
Regenerate the secret after exposure or staff handover, then update the producer immediately. Disable the monitor during a planned endpoint migration if stale errors would create noise.