

Appearance
Device Diagnostics #
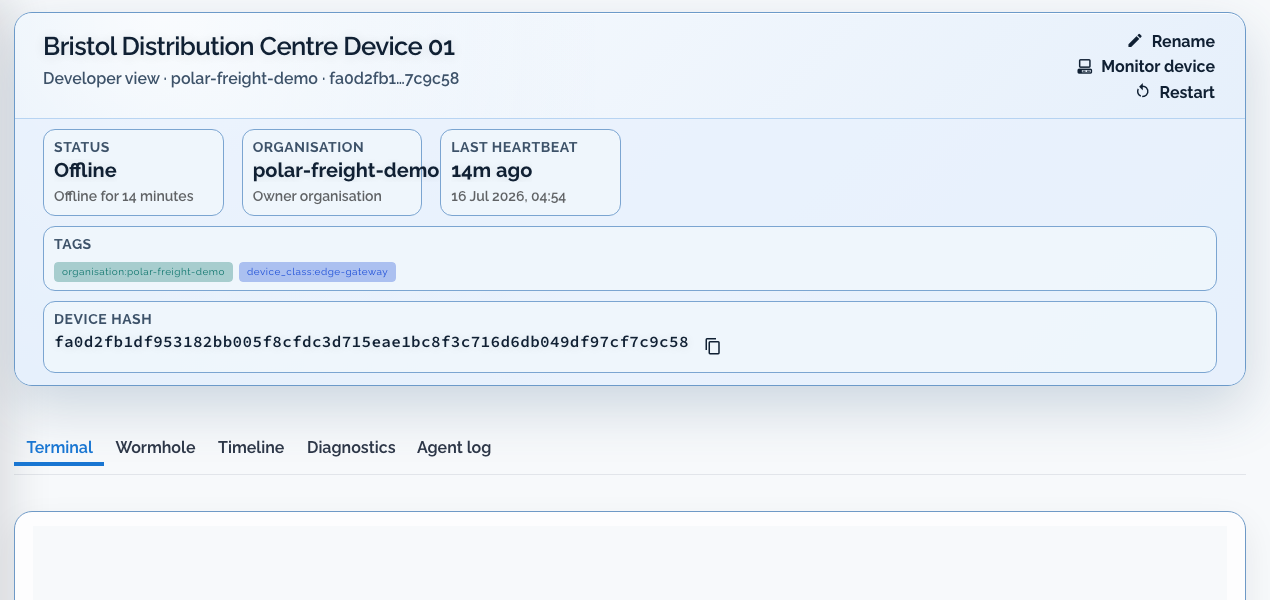
Diagnostics is the host and system inspection surface on the device workspace. Use it when you need facts about the unit without starting an interactive shell.
When to use it #
- Confirm hardware, OS, or resource context before a support action
- Compare a failing unit with a healthy peer in the same class
- Gather non-interactive evidence while the device is online but unstable for a long shell session
Diagnostics is not a substitute for application logs, monitors, or customer-specific telemetry. Prefer Search logs for application output and Create monitors and alerts for recurring health checks.
How to read it #
- Open the device record and confirm the full device hash, class, tags, and last heartbeat.
- Select Diagnostics.
- Capture the facts that answer the current question - hardware, network interfaces, resource pressure, or other available diagnostic sections.
- Preserve relevant findings on the incident timeline or in the support ticket rather than relying on a transient browser view.
Availability depends on organisation entitlements and the diagnostics.read permission. If the tab is not present, use logs, monitors, Agent Log, and remote access within your role instead.
Related evidence surfaces #
| Surface | Question it answers |
|---|---|
| Diagnostics | What does the host report about itself right now? |
| Timeline | What lifecycle and operational events happened recently? |
| Agent Log | What did the Dataplicity agent on this device report? |
| Logging | What application or system lines were retained for this device or class? |
| Class monitoring | Which class-inherited checks and latest values apply to this unit? |
Class-inherited monitoring status and disk-space history are also available through the Gateway API when you need them outside the dashboard.