

Appearance
Lab: Diagnose the Northstar cold-chain incident #
This worked example joins the four Platform depth guides into one response.
The names and events come from the Northstar demonstration fleet shown in the documentation screenshots. The method is real; the incident is illustrative. Meet the wider cast in Illustrative customers.
Situation #
Polar Freight reports a gap in temperature data from Bristol Distribution Centre. The support queue points to Bristol Freezer Sensor 01, but the fleet contains other freezer sensors, gateways, kiosk controllers, and devices on several network providers.
The team needs to answer:
- Is one sensor broken, or did a meaningful cohort move together?
- What happened immediately before the gap?
- Is an interactive action safe and useful?
- If the device will not stay online, how can support collect local evidence?
- What proves recovery?
Response map #
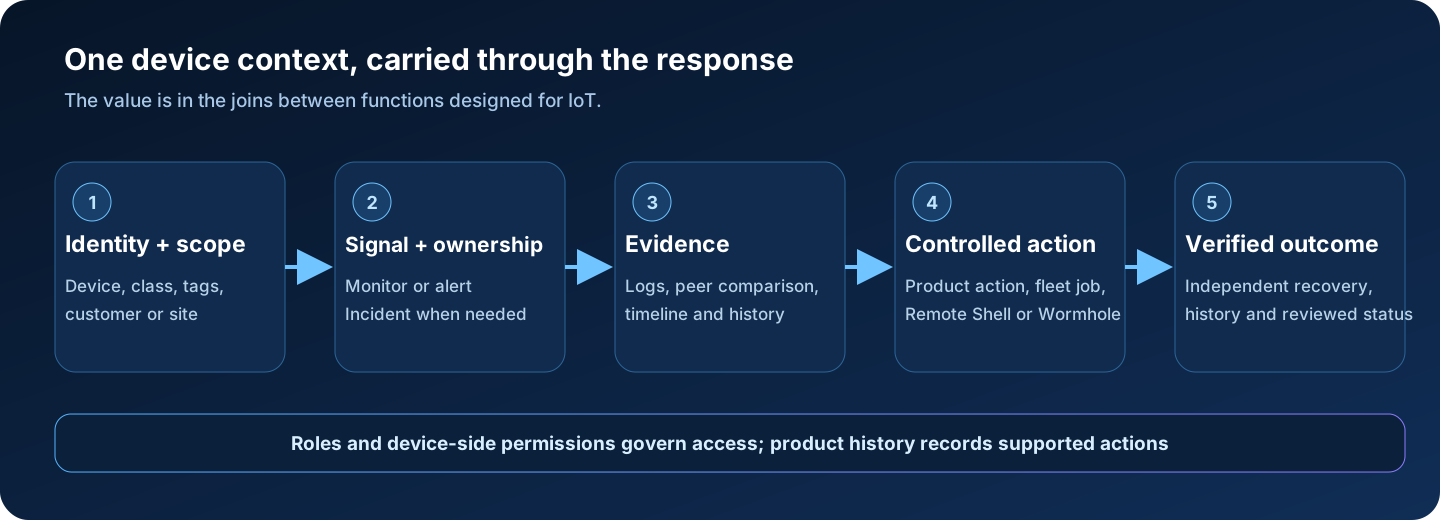
Stage 1: establish identity and scope #
Open inventory and search for the reported unit. Do not act from the display name alone.
Confirm:
| Field | Lab value |
|---|---|
| Organisation | Polar Freight demo |
| Site | Bristol Distribution Centre |
| Device | Bristol Freezer Sensor 01 |
| Product class | Environmental sensor |
| Environment | Production |
| Workload | Cold chain |
| Release cohort | Check the current tag |
| ISP cohort | Check the current property tag |
| Immutable identity | Full device hash from the record |
Then filter for peer devices sharing the class and relevant cohort tags.
Decision: if peers at the same site or ISP are also offline, investigate a cohort failure before treating this as a single sensor fault.
Stage 2: read the monitor as an operational statement #
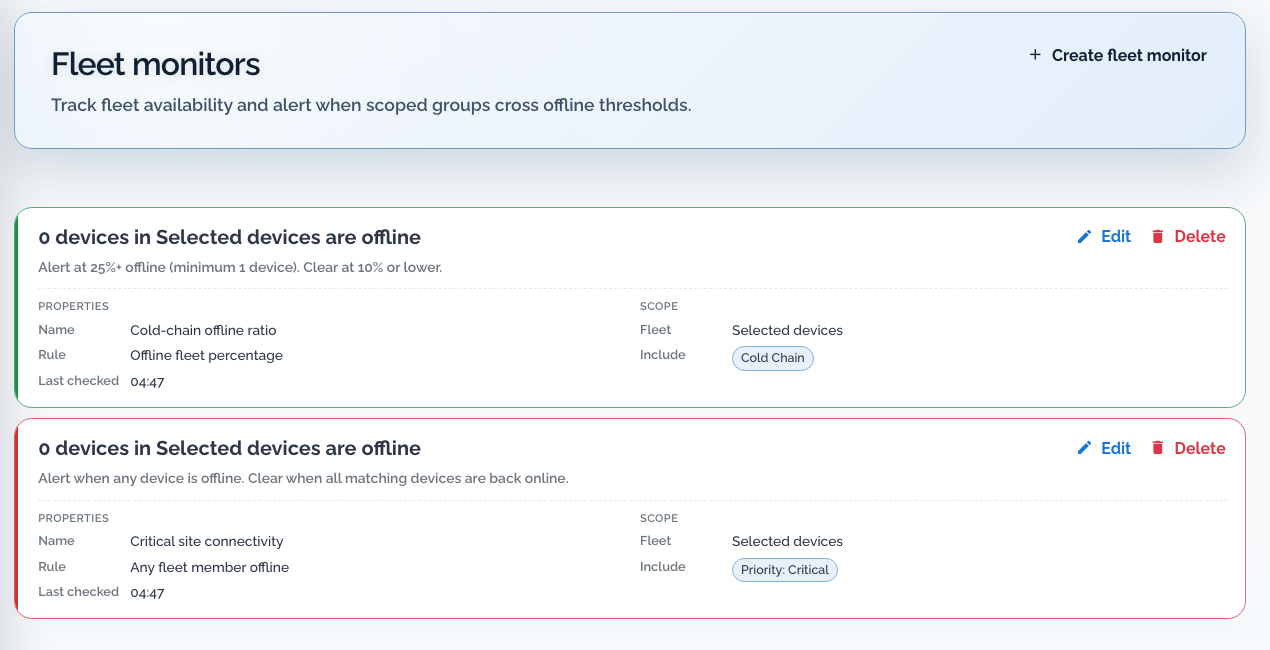
The demonstration fleet contains two useful patterns:
- Cold-chain offline ratio: alert at 25% or more offline, with a minimum impacted count; clear at 10% or lower.
- Critical site connectivity: alert when any selected critical device is offline; clear when all matching devices return.
Before trusting the alert:
- Open the monitor definition.
- Confirm the class and included tags.
- Confirm maintenance or test exclusions.
- Review the resolved target population.
- Check both the ratio and minimum impacted count.
- Note the failed-evaluation streak and recovery rule.
Decision: write the affected cohort and threshold into the incident. “Device offline” is not enough context.
Stage 3: narrow organisation logs around the first signal #
Begin with device and time:
text
device:<full-device-hash> since:"20 minutes ago"Inspect representative rows before adding assumptions.
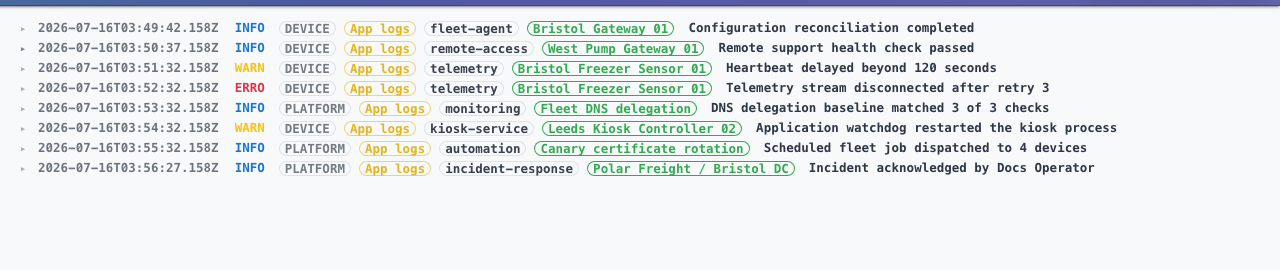
The demonstration stream shows the sort of sequence an operator should distinguish:
- heartbeat delay warning
- telemetry stream error
- monitoring baseline event
- application watchdog action
- scheduled fleet job
- incident acknowledgement
Now ask narrower questions.
Did telemetry fail before or after connectivity degraded? #
text
device:<full-device-hash> app:telemetry since:"20 minutes ago"Did the agent report a connection problem? #
text
device:<full-device-hash> origin:agent since:"20 minutes ago"Did the whole class show the same application failure? #
text
class:<environmental-sensor-class-hash> app:telemetry level:ERROR since:"20 minutes ago"Did a platform action happen in the same window? #
Inspect platform-origin rows and job history. Do not infer causality from timing alone.
Decision: preserve the scoped query and representative evidence. Record whether the symptom is isolated, site-wide, ISP-wide, or class-wide.
Stage 4: choose an action surface #
Use the device status and evidence to select the least invasive useful action.
| Evidence state | Next action |
|---|---|
| Device online and one bounded read can answer the question | Remote Shell or device Diagnostics |
| Device flaps and local evidence is already prepared | File Transfer |
| Several previewed peers need the same safe command | Guarded fleet job |
| Existing logs already answer the question | No interactive device action |
| Action requires application-level ownership | Escalate to the owning team |
If one device is stably online #
Open the device workspace. Confirm the full hash again. Prefer read-only checks before a restart or configuration change.
If a selected cohort needs the same action #
Prepare a Fleet job only after previewing the class and tags.
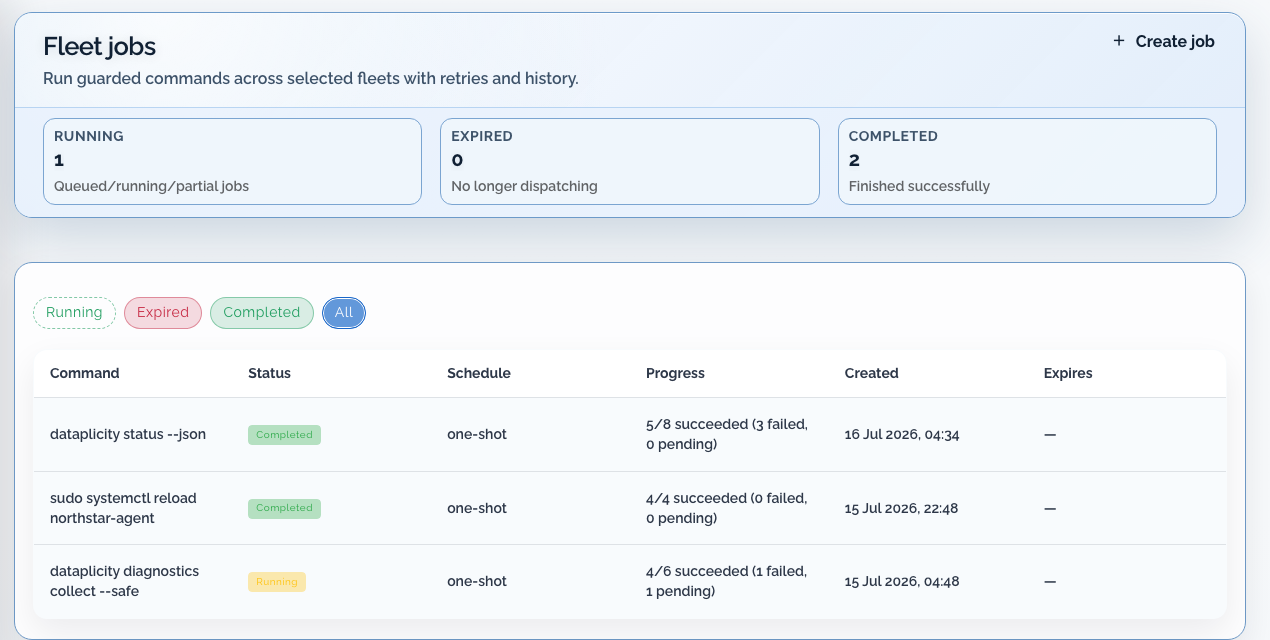
For each target, record:
- succeeded
- failed
- pending
- expired without dispatch
Do not use one successful unit as proof for the cohort.
If the device will not stay online #
Request the prepared support bundle from /home/dataplicity/remote.
Record:
- file name
- device hash
- snapshot time
- expected size
- request state
Keep it marked pending until the complete artifact is assembled and validated.
Stage 5: preserve ownership and decisions #
An incident should contain:
- affected customer/site and device or cohort
- monitor and trigger condition
- first-observed time
- scoped log query
- observation and interpretation as separate statements
- chosen action and approval
- fleet-job target summary or file-request state
- customer communication, where required
- independent recovery evidence
Avoid pasting an unbounded log dump. Link the evidence and explain why it matters.
Stage 6: verify recovery independently #
The action surface should not grade its own work.
Use at least one independent signal:
- new application telemetry from the affected device
- monitor below the recovery threshold for the required successful evaluations
- service or heartbeat monitor healthy
- customer-visible path checked from the outside
- inventory and last-heartbeat state updated
- healthy peer comparison restored
If a command reports success but telemetry remains absent, the incident is not recovered.
What the joined workflow reveals #
| Without the joined context | With the joined context |
|---|---|
| “A freezer sensor is offline” | Exact device, customer, site, class, and cohort |
Search every log for timeout | Query starts with device/class and first-observed time |
| Restart the reported unit | Choose action only after cohort and evidence review |
| Run a shell loop across peers | Previewed Fleet job with per-target results |
| Give up when the device disconnects | Pending file request accumulates across later connections |
| Close when the command returns zero | Close after an independent recovery signal |
The power is not one feature in isolation. It is keeping identity, population, evidence, action, and verification attached to the same operational case.
Try it with your own fleet #
Run the lab in staging:
- Choose one non-critical class and a small test tag cohort.
- Verify central log ingestion with a distinctive event.
- Create and test a Fleet monitor against the cohort.
- Interrupt one device and wait for the configured trigger.
- Move from the alert into a scoped log query.
- Prepare a harmless read-only Fleet job and inspect every result.
- Stage a small diagnostic file and test File Transfer if enabled.
- Restore connectivity and wait for the recovery rule.
- Review the incident record with a second operator.