

Appearance
Logging for a fleet, not a terminal #
On one Linux device, logs are files and journalctl. Across a deployed product, they are an operating system for evidence.
Dataplicity Logging combines device, agent, platform, and externally ingested events in one organisation stream. Every useful row can carry the context that generic log aggregation normally has to reconstruct later: device, class, application, origin, source type, event type, level, and time.
That makes the logging console useful for much more than reading errors. An operator can watch a rollout, move from a fleet alert into the right time window, compare one device with its peers, turn a recurring pattern into a throttled webhook, and preserve the evidence with an incident - the same loop Meridian Autonomy needs during a pilot OTA, and Northstar needs when Polar Freight reports a telemetry gap.
What the logging workspace gives you #
| Capability | What it changes operationally |
|---|---|
| Organisation-wide stream | Search device, agent, platform, and external events without opening a terminal on every unit. |
| Device and class context | Move from “an error happened” to “which product, device, or cohort produced it?” |
| Live and retained data | Watch current behaviour, then seek into the retained window when the incident started earlier. |
| Field-aware search | Restrict by device, class, application, origin, source type, level, and time before adding text. |
| Context around a row | Inspect what happened immediately before and after a matching event. |
| Log alert rules | Turn a recurring pattern into a grouped, throttled webhook signal. |
| Investigations and analytics, where enabled | Preserve evidence threads and identify noisy devices, applications, origins, anomalies, or security events. |
| Scoped ingestion | Feed external syslog through an organisation API key limited to log ingestion. |
| Shared access | Let support and engineering work from the same retained evidence, subject to team permissions. |
The result is closer to a fleet-aware event viewer than a remote tail. Dataplicity already knows the managed device, its class, and the surrounding operations context; those joins are the advantage.
Read a row as structured evidence #
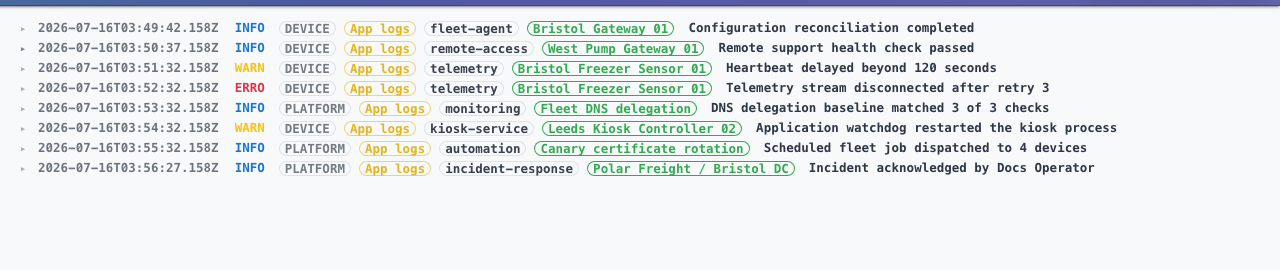
The screenshot above contains several layers of meaning:
- Time anchors the event to an alert, job, deployment, or customer report.
- Level makes warnings and errors visually scannable without discarding informational context.
- Origin distinguishes device output from platform activity.
- Application or source identifies the component that emitted the event.
- Device or resource keeps the row attached to the affected unit, cohort, or operation.
- Message supplies the human-readable detail.
Those fields let an operator ask precise questions:
- Did telemetry fail only on freezer sensors?
- Did an automation job run immediately before the disconnect?
- Did all devices in one class start warning after a rollout?
- Is the incident acknowledgement visible alongside the device evidence?
- Is this an agent problem, an application problem, or a platform action?
Ship enough identity with each event to answer the questions the team will face; volume alone is not useful.
Design the event vocabulary before shipment #
Choose stable values for the dimensions operators will search:
| Dimension | Good use | Avoid |
|---|---|---|
app | gateway, telemetry, kiosk-service | Build IDs or values that change on every restart |
origin | Agent, application, platform, external source | Using one label for unrelated producers |
type | A classified source such as generic syslog | Encoding customer data in the type |
level | A consistent severity policy | Marking every retry as an error |
| device/class context | The managed resource responsible for the event | Copying display names into free text as the only identity |
Keep credentials, tokens, health data, and unnecessary personal data out of logs. Logging is shared operational evidence; it should not become an accidental secrets store.
Before a production rollout, prove the complete path:
- Generate a distinctive, non-secret test event.
- Find it in a short recent window.
- Confirm the device, class, application, origin, level, source type, and timestamp fields your workflow depends on.
- Ask a second operator with the intended role to find the same event.
- Repeat after changing a device image, source configuration, or ingestion route.
Local output proves only that the producer wrote locally. It does not prove central delivery, classification, retention, or access.
Search by scope, then time, then meaning #
The search bar accepts field tokens and remaining text. Tokens restrict the result set; remaining words match log content.

Query grammar #
| Token | Restricts by | Example |
|---|---|---|
device: | Device hash | device:abc123 |
class: | Device-class hash | class:def456 |
app: | Application label | app:gateway |
origin: | Event origin | origin:agent |
type: | Classified source type | type:generic_syslog |
level: | Log level | level:ERROR |
since: | Beginning of the time window | since:"15 minutes ago" |
| free text | Message content | timeout |
Combine restrictions with spaces:
text
device:abc123 app:gateway level:ERROR timeoutQuote relative times containing spaces:
text
class:def456 since:"30 minutes ago" level:WARN reconnectA repeatable narrowing sequence #
Do not begin with the most dramatic word in the incident. Begin with the smallest defensible scope.
- Add
device:when one unit raised the signal, orclass:when the product cohort matters. - Add
since:just before the first observed failure. - Inspect representative rows.
- Add
app:,origin:,type:, orlevel:only when those fields are present and useful. - Add free text last.
- Open context around a useful row to inspect preceding and following activity.
- Compare the result with a healthy peer or an earlier window.
This prevents an organisation-wide search for timeout from hiding the fact that only one application, class, or rollout cohort changed.
Five query recipes worth keeping #
1. Start from an offline alert #
text
device:abc123 since:"15 minutes ago"Look for the last healthy event, the first retry or warning, and any platform action in the same window. Add an application or origin only after the stream shows which producer matters.
2. Compare a class after a rollout #
text
class:def456 app:gateway since:"2 hours ago" level:ERRORUse this to establish whether failures are isolated or distributed across the product class. Compare against a pre-rollout window before attributing causality.
3. Separate the agent from the application #
text
device:abc123 origin:agent since:"30 minutes ago"Use the organisation stream for shared evidence. Open the device workspace's Agent Log when the question is specifically about that agent instance and its local connection behaviour.
4. Inspect externally ingested syslog #
text
type:generic_syslog level:ERROR certificateConfirm that source classification and device context survived ingestion. If they did not, fix the producer or ingestion contract rather than compensating with increasingly broad text searches.
5. Follow one application across devices #
text
app:telemetry since:"1 hour ago" disconnectThis is useful when an application-level symptom may cross multiple devices. Add class: if the same application runs on several product lines.
Live stream, archive, and the meaning of “missing” #
Recent records can update live. Older retained records are queried from archive storage where archive data is available. A query crossing those paths can change latency and pagination.
Check the retention period shown for the organisation. If a result is absent, work through the evidence chain:
- Did the producer emit the event?
- Did the source deliver it?
- Did the record include valid organisation and device context?
- Is the source type or origin classified as expected?
- Is the time range inside retention?
- Has the query crossed from live data into archive?
- Does the operator's role permit access?
A blank result is not proof that nothing happened.
Log ingestion is usage-metered. Review included units, current use, and any configured cap before enabling a high-volume source. Filter repetitive events at the producer where practical. Retain enough well-labelled evidence to answer the fleet's operational questions rather than every possible byte.
Turn a useful search into an operational signal #
A log alert rule can match level, application, origin, source type, and remaining text. It can group matching events by device, application, or origin and send a webhook subject to throttling.
Use grouping and throttling to express the actual failure:
| Failure pattern | Useful grouping |
|---|---|
| One broken unit emits the same error repeatedly | Device |
| One application fails across many devices | Application |
| One ingestion source becomes noisy | Origin |
Test with representative records. Secure the receiver, handle duplicate delivery, and do not assume that every interactive viewer token is supported by the alert-rule evaluator.
A log alert is a signal, not an incident. It does not assign ownership, authorise a corrective action, or prove recovery.
Preserve the investigation #
Where Log investigations are enabled, an investigation can retain the query, time window, detector threads, expanded evidence, notes, and pins. That turns an ad hoc search into a reviewable evidence trail.
Where they are not enabled, preserve the same minimum context in the incident timeline:
- device or cohort examined
- exact time boundary
- query used
- representative event links or excerpts
- observation separated from interpretation
- comparison with a healthy peer or earlier window
- independent recovery signal
Where analytics are enabled, use trends, error rates, noisy devices, applications, origins, source types, event types, anomalies, and security-event views to find a direction. Confirm conclusions against matching raw records because classification, freshness, and selected windows can differ.
Choose the right evidence surface #
| Need | Use |
|---|---|
| Search events across devices, classes, applications, and platform actions | Organisation Logging |
| Diagnose the Dataplicity agent on one device | Device workspace Agent Log |
| Retrieve a bounded large artifact from intermittent connectivity | File Transfer |
| Inspect application metrics or traces already owned elsewhere | Existing observability stack |
| Preserve ownership, decisions, and verified recovery | Incident record |
Dataplicity Logging does not need to replace every observability tool to be valuable. Its strongest role is the device-linked operational layer: evidence already joined to the fleet identity and response workflow.
Production checklist #
- [ ] Stable application, origin, type, and severity vocabulary
- [ ] Device and class context present on representative events
- [ ] Non-secret end-to-end test event verified centrally
- [ ] Support role tested with a second operator
- [ ] Retention and ingestion usage reviewed
- [ ] Noisy sources filtered at the producer where practical
- [ ] Alert rules tested with grouping, throttle, and duplicate delivery
- [ ] Incident handoff records query and time boundary
- [ ] Recovery verified independently of the log line that reported it
Continue the series #
- Logging for a fleet, not a terminal
- Run the fleet from one browser workspace
- Monitor the cohort, not just the device
- Request the evidence now; let connectivity catch up
- Lab: Diagnose the Northstar cold-chain incident