

Appearance
Platform depth #
Dataplicity is not only a way to open a terminal on a Linux device.
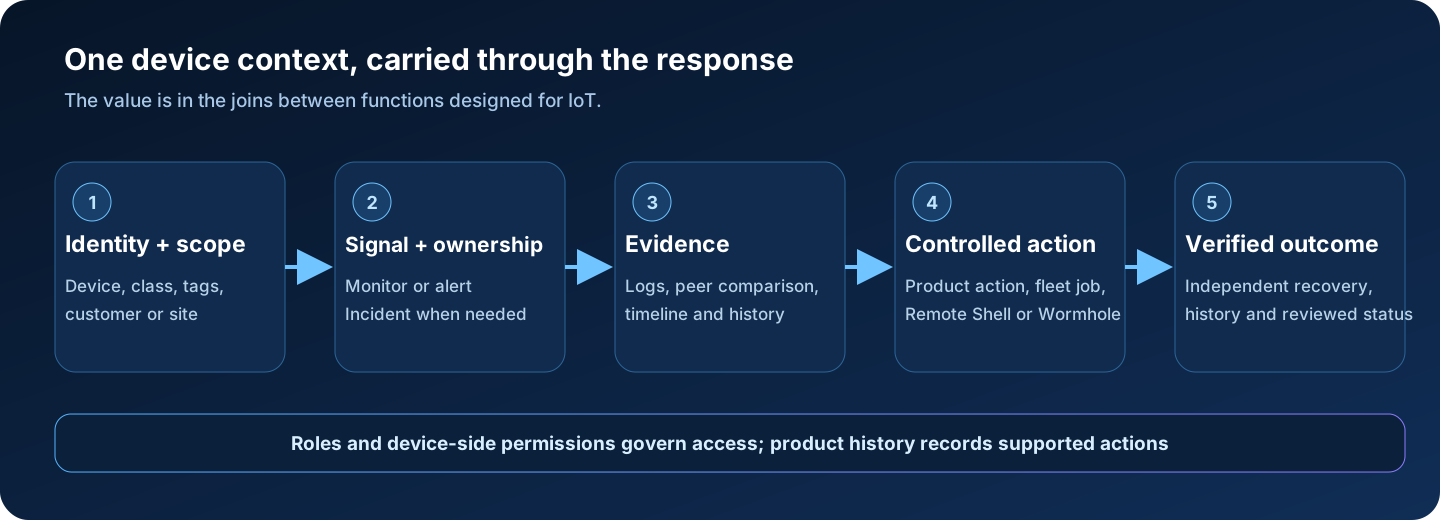
It is an operating layer for the part of a connected product that begins after shipment: identifying the right device and cohort, detecting a meaningful change, gathering evidence, taking a controlled action, and proving the outcome.
These guides show the product in use. They include focused product screenshots, query and selector recipes, production checklists, failure modes, and one end-to-end incident lab. Screenshots and labs use the illustrative customers cast - especially Northstar and Polar Freight.
Choose a guide #
Logging for a fleet, not a terminal #
Centralise device, agent, platform, and external events in one organisation stream. Learn the field-aware query grammar, work through five investigation recipes, turn repeated patterns into throttled webhook signals, and preserve evidence with an incident.
Run the fleet from one browser workspace #
See how inventory, device context, Logging, monitors, Fleet jobs, incidents, Remote Shell, Wormhole, Diagnostics, Agent Log, and the Web CLI divide responsibility while keeping the same fleet identity.
Open the browser workspace guide →
Monitor the cohort, not just the device #
Build fleet signals from classes, property tags, custom tags, any/all matching, exclusions, ratios, minimum impacted counts, persistence, and hysteresis. Use worked patterns for ISP cohorts, cold-chain sites, rollout waves, and maintenance.
Open the Fleet monitors guide →
Request evidence across unreliable connectivity #
Understand File Transfer snapshots and chunking, design a safe /home/dataplicity/remote handoff directory, build bounded diagnostic bundles into the image, and validate evidence collected over several short connections.
Open the File Transfer guide →
See the features work together #
Diagnose the Northstar cold-chain incident is a complete worked lab:
- identify the customer, site, device, class, and tag cohort
- interpret a cold-chain Fleet monitor
- narrow organisation logs around the first signal
- choose Remote Shell, Fleet job, or File Transfer based on evidence
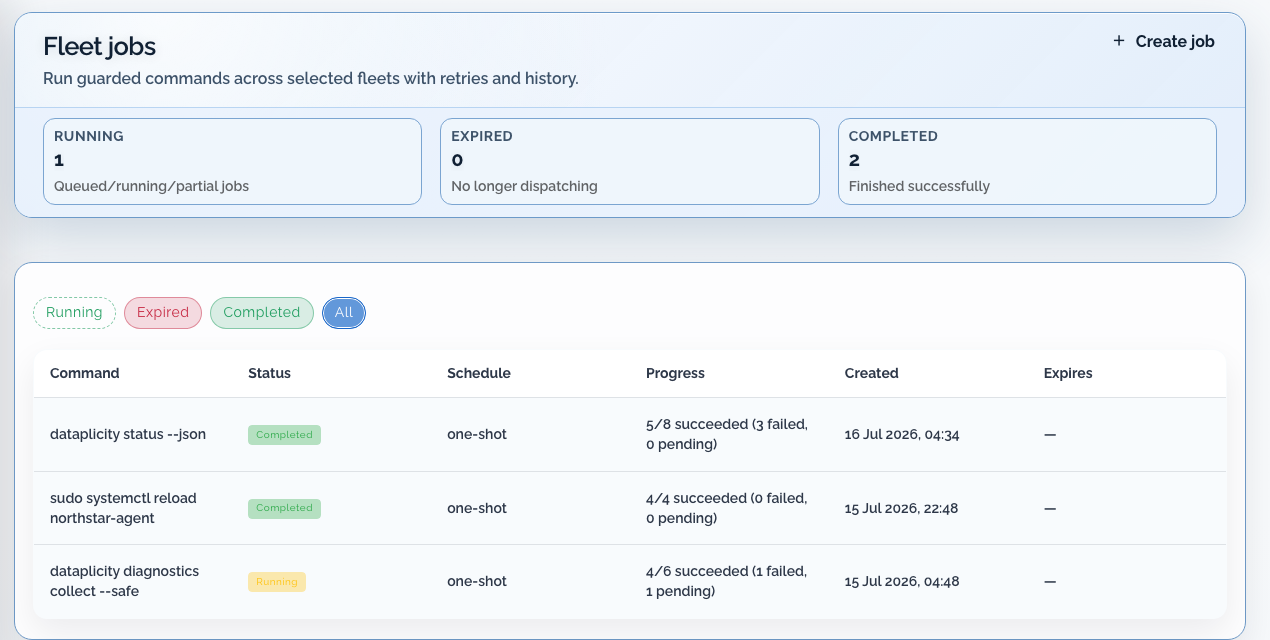
- inspect per-target outcomes
- close only after independent recovery
Capability map #
| Operational need | Dataplicity capability | Deep guide |
|---|---|---|
| Search one time window across device and platform activity | Organisation Logging | Logging |
| Distinguish one failed device from a failed population | Fleet monitors + tags | Fleet monitors |
| Keep identity visible while moving between tools | Browser workspace | Browser operations |
| Execute across selected devices and inspect every result | Fleet jobs | Browser operations |
| Collect a prepared artifact from a flapping device | File Transfer | File requests |
| Preserve ownership, decisions, and recovery | Incidents | Northstar lab |
Reference remains task-focused #
The Platform depth guides explain capability, design, and composition. Use the canonical reference pages for concise task instructions: