

Appearance
Monitor the cohort, not just the device #
One offline device may be a local fault. Twenty offline devices may be twenty local faults, one ISP outage, one site power loss, one rollout regression, or one product-class failure.
A flat offline count cannot tell those stories apart. A fleet monitor can, when its selector represents an operational hypothesis.
Dataplicity Fleet monitors combine a device class with included and excluded tags. They can alert when any selected device is offline, when an offline count is crossed, or when an offline ratio and minimum impacted count are both crossed. Evaluation intervals, consecutive failures, recovery thresholds, consecutive successes, and cooldown shape when the signal opens and clears.
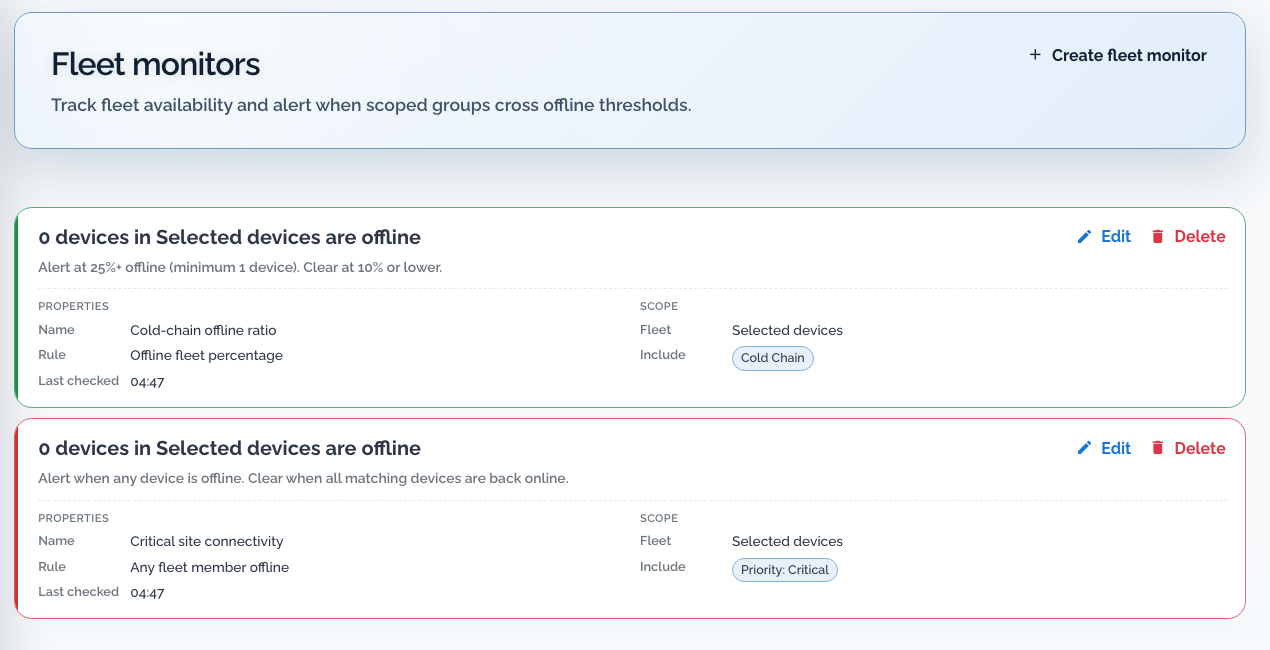
What makes a fleet monitor powerful #
| Layer | Decision |
|---|---|
| Class | Which product line or deployment configuration belongs in the population? |
| Include tags | Which site, environment, ISP, firmware, or rollout cohorts matter? |
| Match mode | Must a device match any include tag or all of them? |
| Exclude tags | Which maintenance, test, or exception cohorts must stay out? |
| Condition | Does one offline device matter, a count, or a percentage? |
| Minimum impacted | How many devices must be affected before a ratio is meaningful? |
| Trigger persistence | How many failed evaluations establish the condition? |
| Recovery | What lower threshold and success streak prove that the fleet is stable again? |
| Cooldown | How quickly may the same signal repeat? |
The monitor is only as good as the population it resolves.
Build a taxonomy that describes operations #
Dataplicity uses several kinds of fleet identity:
| Identity | Example | Use |
|---|---|---|
| Device class | Environmental sensor | Product line and deployment configuration |
| Property tag | location:isp:starlink | A characteristic detected from the device or connection |
| Custom tag | cohort:beta | Operational intent controlled by your organisation |
| Customer/site record | Polar Freight / Bristol DC | Business ownership and location where those modules are enabled - see illustrative customers |
| Network | Organisation-owned device grouping | Membership and operational statistics |
Custom tag dimensions might include:
text
environment:production
site:manchester
cohort:beta
firmware:2.2
priority:critical
maintenance:activeKeep dimensions separate. A site is not a firmware version. A rollout cohort is not a customer. Do not compress several dimensions into labels such as acme-production-beta.
Choose an owner for each namespace. Apply stable metadata during provisioning where possible. Review untagged and multiply assigned devices. Keep secrets, personal data, and rapidly changing telemetry out of tags.
See the selector in inventory first #
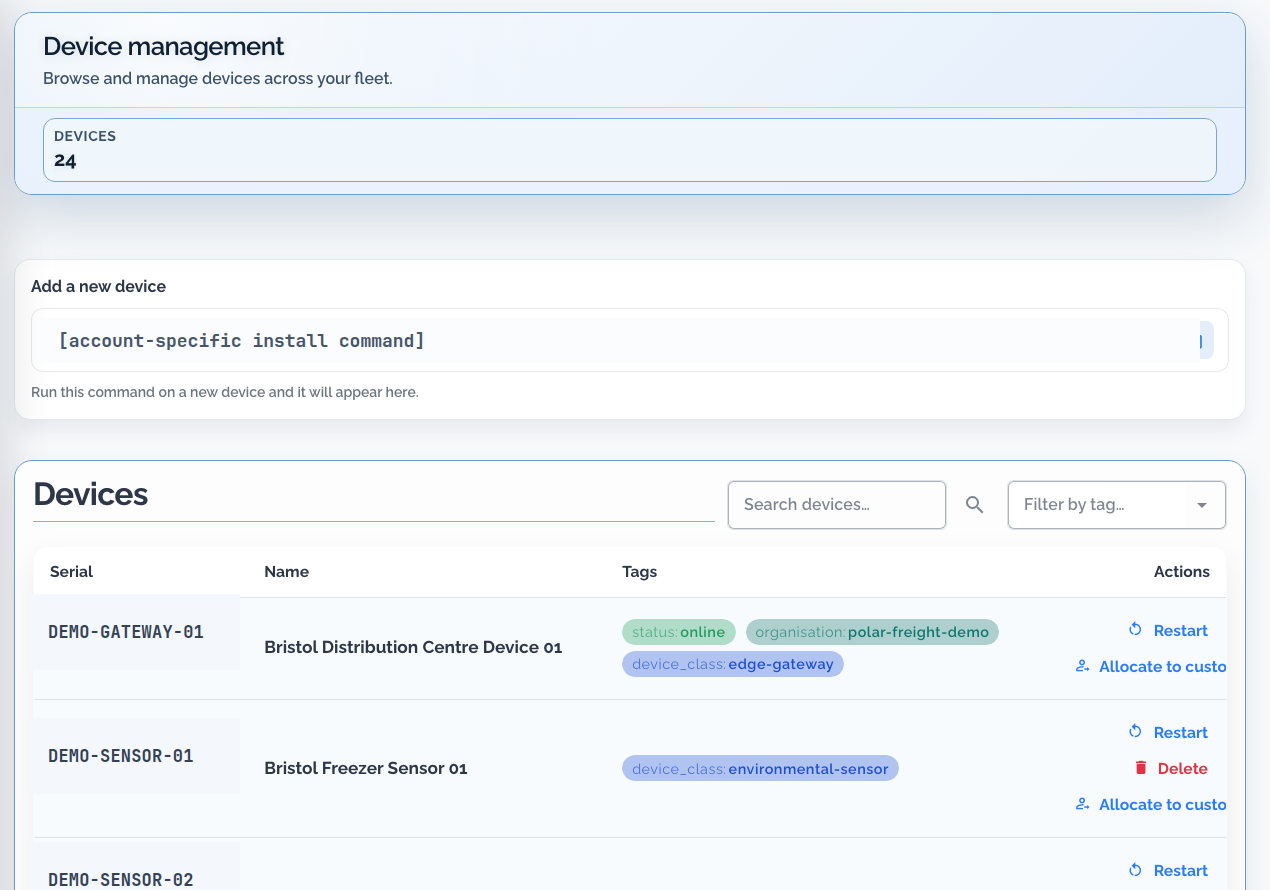
Before creating a monitor:
- Filter the inventory by the proposed class and tags.
- Inspect edge cases and devices with missing metadata.
- Identify maintenance and test cohorts that need exclusion.
- Decide who owns future tag changes.
- Write down the question the selector is intended to answer.
Examples:
- “Are production gateways using Starlink becoming unreachable together?”
- “Is at least 10% of the beta firmware cohort offline, with three or more devices affected?”
- “Has any critical cold-chain gateway disappeared outside maintenance?”
If the question cannot be stated clearly, the alert will be difficult to interpret.
Understand any, all, and exclude #
A Fleet monitor supports one device class, include tags matched by any or all, and exclude tags.
Any #
A device enters the selected population when it matches at least one include tag.
text
include any:
  site:manchester
site:bristolUse this when either site belongs in the same operational population.
All #
A device enters only when it matches every include tag.
text
include all:
  environment:production
priority:criticalUse this for intersections such as critical production units.
Exclude #
Exclusions apply after inclusion:
text
exclude:
  maintenance:active
environment:testPreview the resolved set before saving. Preview it again after provisioning or taxonomy changes. A tag edit can change an existing monitor without changing the monitor definition itself.
Target preview is a control boundary, not a cosmetic count.
Choose the condition that matches the service model #
Any offline #
Use when every selected device is individually critical.
Example: four gateways each serve a site with no redundant path. One missing gateway needs attention.
Offline count #
Use when the number affected matters more than fleet size.
Example: a support team can tolerate two kiosk controllers offline, but five suggests a common failure or exceeds field capacity.
Offline ratio plus minimum impacted #
Use when population size changes and a percentage represents impact, but small fleets need a count guard.
text
trigger ratio: 0.10
minimum impacted: 3If two of twenty devices are offline, the ratio is exactly 10%, but the minimum count of three is not met. The monitor does not trigger.
If six of fifty are offline, the ratio is 12% and the minimum is met. The condition triggers after the configured failed evaluations.
The minimum prevents a single device in a small or changing population from satisfying a percentage that was intended to represent a fleet event.
Control flapping with persistence and hysteresis #
A threshold is not enough on intermittent networks.
Configure:
- evaluation interval
- consecutive failed evaluations to trigger
- consecutive successful evaluations to recover
- recovery ratio
- cooldown
The default is three failed evaluations to trigger and three successful evaluations to recover. Check the saved monitor and organisation service limits for effective values.
For a 25% trigger, a 10% recovery threshold means:
text
0% ───── 10% ─────────────── 25% ───── 100%
clear at or below trigger at or aboveThat gap is hysteresis. It prevents the monitor from opening and closing repeatedly while the fleet oscillates around one boundary.
Tune persistence to the cost of delay. A cold-chain gateway and a low-priority display should not automatically share the same evaluation interval or trigger streak.
Pattern 1: distinguish Starlink from the product #
Devices can carry ASN-derived property tags such as:
text
location:isp:starlinkand other location:isp:* values.
Build a monitor around the ISP cohort, then compare it with the rest of the class:
text
class:
  edge-gateway

include all:
  environment:production
  location:isp:starlink

exclude:
  maintenance:active

condition:
  offline ratio 0.15
minimum impacted 3When that monitor changes while non-Starlink peers remain healthy, the team has evidence for a provider-cohort investigation before starting a firmware rollback or dispatch.
The ISP value is inferred from viewer ASN at authentication, not modem telemetry. It supports cohort operations, not long-term carrier analytics. On supported plans, per-device connection quality provides a short recent view of reachability and latency for closer inspection.
Pattern 2: protect critical cold-chain sites #
Suppose every critical cold-chain gateway matters individually.
text
class:
  edge-gateway

include all:
  environment:production
  workload:cold-chain
  priority:critical

exclude:
  maintenance:active

condition:
any offlineThis monitor answers a narrow business question: “Is any production gateway protecting a critical cold-chain site currently unreachable?”
It should not include development sensors, non-critical displays, or devices deliberately taken down for maintenance.
Pattern 3: watch a firmware rollout wave #
Tag the controlled wave:
text
cohort:beta
firmware:2.2Use all matching so only devices carrying both labels enter the monitor. Compare the cohort with stable peers in inventory and Logging.
The monitor can show that the rollout population moved differently. It does not prove firmware causality by itself. Confirm the time relationship, application evidence, and behaviour of a healthy peer.
Keep cohort tags accurate as devices advance or roll back. Stale metadata can hide the changed units or make a healthy release look faulty.
Pattern 4: exclude planned maintenance without hiding recovery #
An exclusion such as maintenance:active is useful only when its lifecycle is owned.
Define:
- who applies it
- when it expires
- who removes it
- how overdue maintenance tags are reviewed
- whether recovery must be confirmed before removal
A permanent maintenance exclusion becomes an invisible blind spot.
Test the complete signal path #
Use staging devices or a deliberately small cohort:
- Preview every resolved target.
- Confirm that excluded devices are absent.
- Interrupt connectivity on the test cohort.
- Wait for the configured failed evaluations.
- Confirm the alert links to the monitor and resource context.
- Open a scoped log query around the first failure.
- Restore connectivity.
- Wait for the successful recovery evaluations.
- Confirm the clear threshold behaves as designed.
- Review whether cooldown prevents unwanted repeat noise.
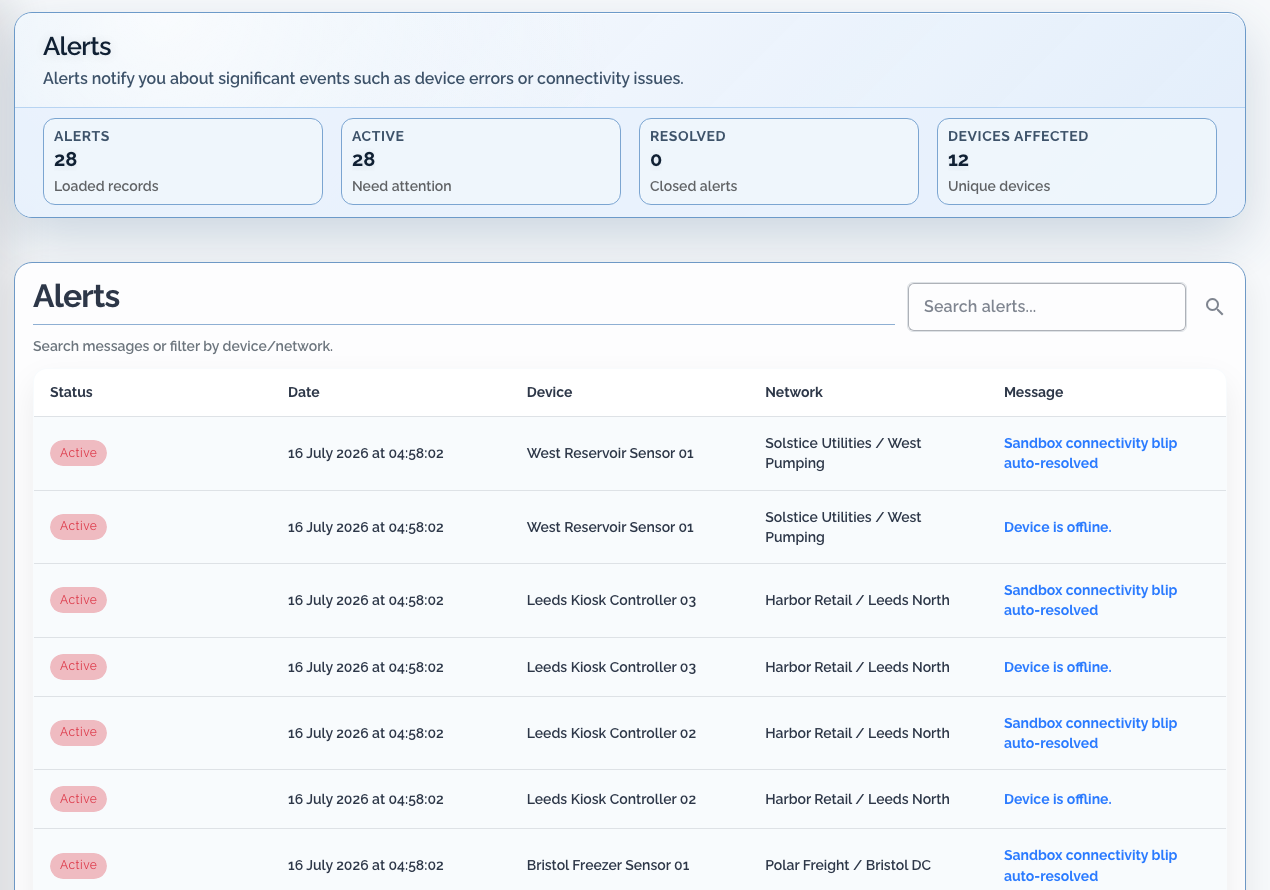
Device and Fleet monitors create alerts. They do not directly provide incident ownership, acknowledgement, escalation, or customer communication. Use incident automation when those controls are required.
Taxonomy failure modes #
| Failure | Consequence | Control |
|---|---|---|
prod, production, and environment:production coexist | Incomplete selectors | Publish one namespace vocabulary |
| Maintenance tags are never removed | Permanent blind spots | Assign expiry and review |
| Provisioning adds a tag silently | Existing monitor scope changes | Re-preview after taxonomy changes |
| Customer and environment are combined | Tags become hard to reuse and clean | Keep dimensions separate |
| A property tag is treated as live telemetry | Incorrect conclusions | Understand when and how the tag is derived |
| Tag visibility is mistaken for device access | Confusing permission failures | Check role, group, network, class, and customer scope |
Production checklist #
- [ ] Each tag namespace has an owner and written meaning
- [ ] Customer, site, class, property, and custom identity stay distinct
- [ ] Include mode is deliberately any or all
- [ ] Maintenance and test populations are excluded
- [ ] Target preview is reviewed before save
- [ ] Ratio monitors have a meaningful minimum impacted count
- [ ] Recovery threshold is below trigger where hysteresis is needed
- [ ] Failed and successful evaluation streaks match network behaviour
- [ ] Alert-to-log and alert-to-incident paths are tested
- [ ] Taxonomy changes trigger monitor-scope review
Continue the series #
- Logging for a fleet, not a terminal
- Run the fleet from one browser workspace
- Monitor the cohort, not just the device
- Request the evidence now; let connectivity catch up
- Lab: Diagnose the Northstar cold-chain incident