

Appearance
Run the fleet from one browser workspace #
Remote shell answers “can I reach this Linux device?” Product operations asks harder questions:
- Which customer, site, class, and rollout cohort does it belong to?
- Is this one device or a population moving together?
- What happened before the failure?
- Who is allowed to act?
- Did the action succeed on every target?
- What independently proves recovery?
The Dataplicity web app keeps those questions close to the managed device record. Inventory, device context, Logging, monitors, fleet jobs, incidents, Remote Shell, Wormhole, Diagnostics, Agent Log, and the Web CLI are distinct surfaces, but they share the organisation and fleet identity that joins the work together.
This is the difference between a terminal launcher and an operations workspace.
The workspace at a glance #
| Surface | Primary question | Typical next move |
|---|---|---|
| Device inventory | Which device or cohort am I dealing with? | Filter, confirm identity, open the record |
| Device workspace | What is true about this unit now? | Inspect status, heartbeat, tags, timeline, diagnostics, or agent output |
| Logging | What happened around the signal? | Narrow by device/class and time |
| Fleet monitors | Is a selected population crossing a threshold? | Open the alert and inspect the cohort |
| Fleet jobs | What happened on each target? | Review success, failure, pending, and expiry |
| Incidents | Who owns the response and what was verified? | Acknowledge, record decisions, resolve |
| Web CLI | Can this operator task be expressed as a contextual command? | Run help, confirm context, prefer reads first |
| Gateway API | Should an external system automate this? | Use a documented endpoint and scoped key |
1. Establish identity before opening a control #
Start in inventory or the device record, not in a copied terminal link.
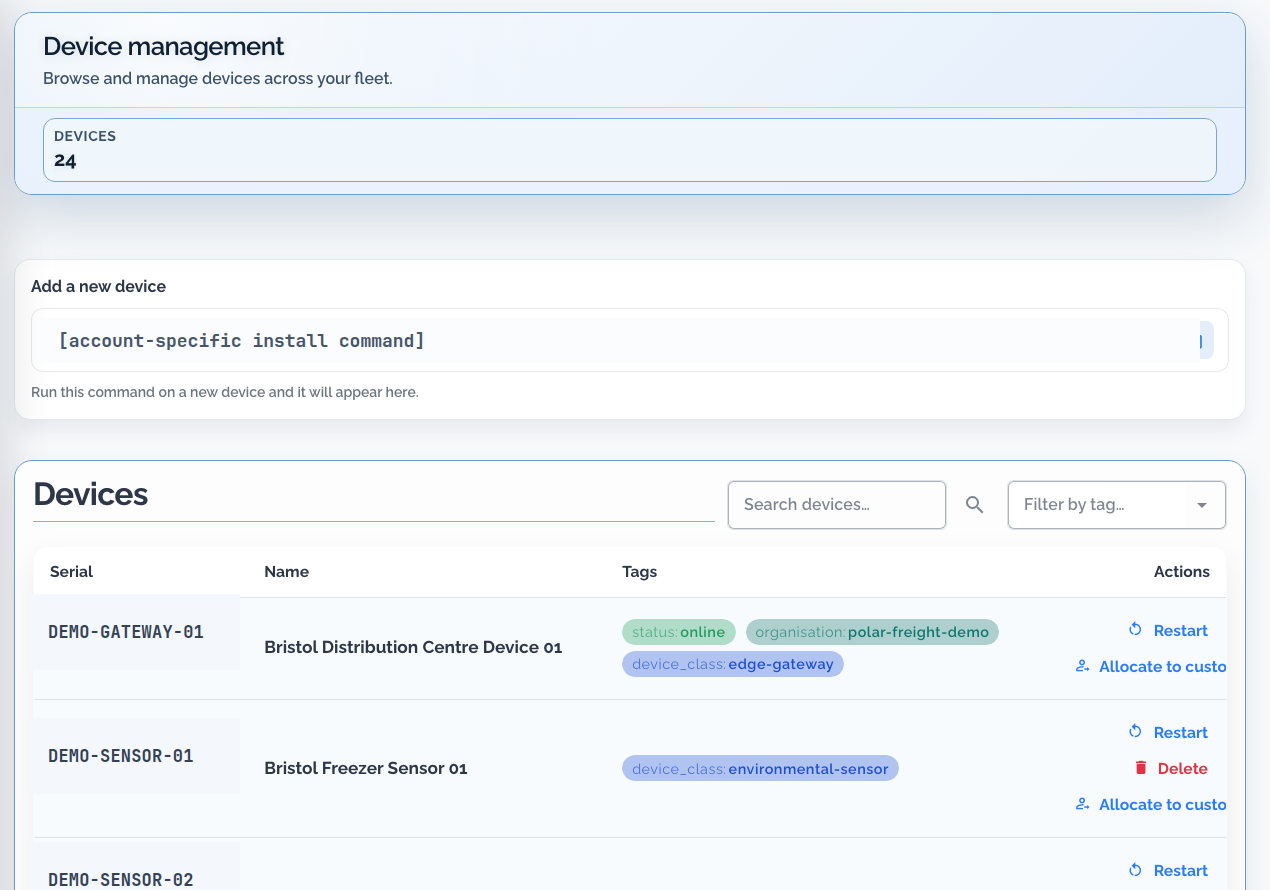
Confirm:
- organisation and effective role
- full device hash
- device name and product class
- customer or site, where those modules are enabled
- property and custom tags
- current status and last heartbeat
- whether nearby devices share the symptom
Display names can be reused. Filters can hide relevant peers. The immutable hash is the final identity check before a mutation.
Inventory is also where a local-looking problem becomes a cohort investigation. A freezer sensor carrying cohort:beta, firmware:2.2, or an ISP property tag may belong to the exact population that changed.
2. Use the device workspace as a context switchboard #
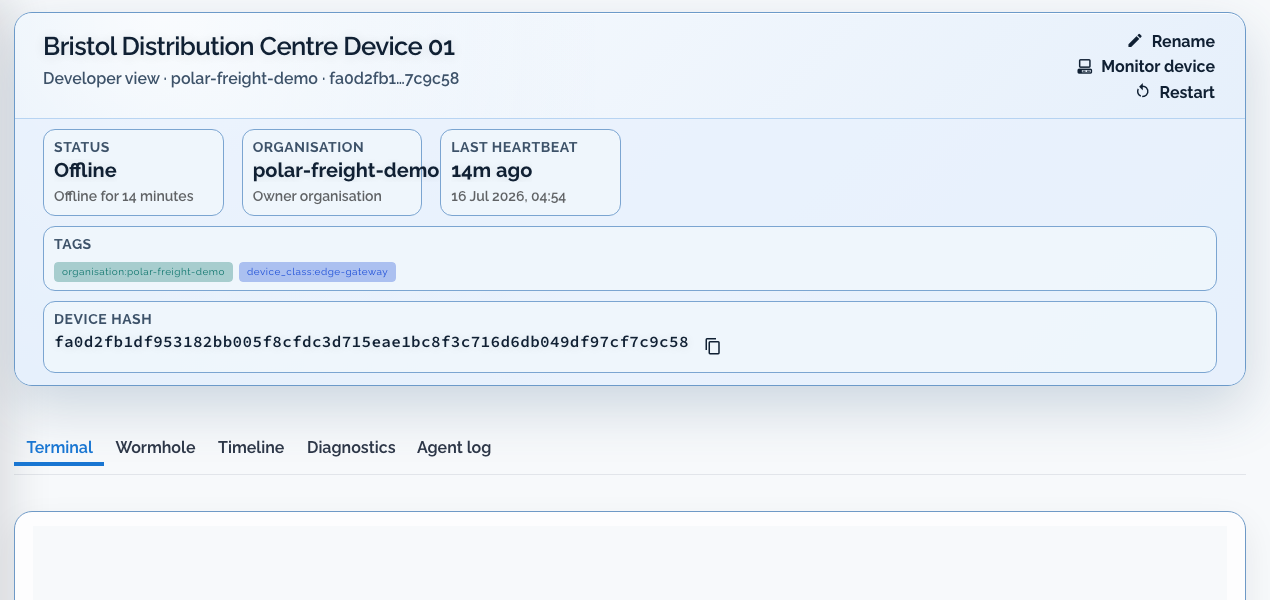
The workspace exposes several paths because they solve different problems:
| Tool | Use it for | Do not treat it as |
|---|---|---|
| Terminal | Interactive command-line diagnosis and a bounded fix | Fleet selection, ownership, or proof of recovery |
| Wormhole | An authorised web service running on the device | A replacement for application authentication |
| Timeline | Supported device and platform history | A complete audit record for every external side effect |
| Diagnostics | Available diagnostic information for the device | A substitute for application-specific evidence |
| Agent Log | The Dataplicity agent on this device | The organisation-wide Logging stream |
The status and last heartbeat should influence the method. An offline or flapping device is a poor candidate for a long interactive session. A file request or retained central logs may make progress when a terminal cannot.
3. Move from signal to evidence without losing scope #
A disciplined browser path looks like this:
- Open the alert or reported device.
- Confirm the full identity and affected business context.
- Inspect the relevant fleet monitor or tag cohort.
- Open Logging at the first-observed time.
- Compare with a healthy peer.
- Decide whether the next action belongs on one device or a selected fleet.
- Preserve ownership and verification in an incident when escalation is required.
The advantage is not fewer clicks. It is fewer opportunities to paste the wrong hostname, lose the time boundary, or forget which cohort justified the action.
4. Use Fleet jobs for bounded multi-device action #
A shell loop can send a command to many devices. It does not naturally provide target preview, per-target progress, expiry, retries, or a reviewable job record.
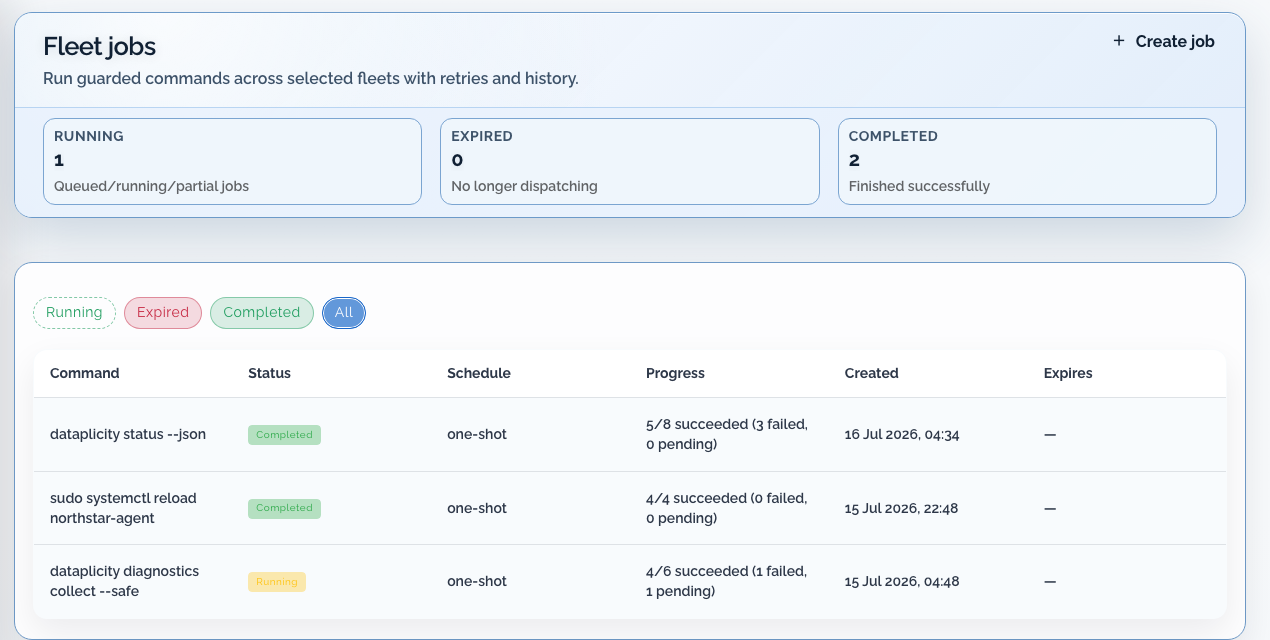
The jobs view makes three distinctions visible:
- job state: running, expired, or completed
- command and schedule: what was dispatched and how
- per-target outcome: succeeded, failed, or still pending
That prevents a green “completed” label from being mistaken for universal success. In the example above, one completed job succeeded on five of eight targets and failed on three.
A safe fleet action pattern #
- Build a selector from class and tags.
- Preview the resolved devices.
- Remove maintenance, test, or otherwise excluded cohorts.
- Use a bounded, non-interactive command.
- Review expected effect and failure mode.
- Dispatch.
- Inspect each target in the job details.
- Verify through inventory, logs, monitoring, or application state.
Selection determines scope. Dispatch performs work. Verification is a separate step.
5. Use the Web CLI for contextual operator commands #
The Web CLI runs inside the Dataplicity app with the signed-in organisation, role, and device context. It requires no local installation.
Open the Web console and run:
text
helpThe available catalogue can include:
- device listing and context
- tag operations
- provisioning flows
- single-device command and terminal actions
- monitor listing
- log and security queries
- fleet-job inspection
- guarded recipes
Availability depends on the current role, context, and enabled features. The in-product help output is the command reference for that session.
Context-first command discipline #
- List or locate the target.
- Confirm organisation, customer or site, name, and full hash.
- Read the command's current help.
- Prefer a read before a mutation.
- Use structured output only where help advertises it.
- Verify the result through a different surface.
Interactive display text is not a stable scripting contract.
6. Put a confirmation boundary around consequential recipes #
Guarded recipes prepare a plan before dispatch. The operator reviews the target, command, expected effect, and confirmation code.
The confirmation is bound to the prepared action and can expire. Never reuse a code from another operator, plan, or session.
text
select targets
      ↓
prepare plan
      ↓
review command + expected effect
      ↓
confirm the bound plan
      ↓
dispatch
      ↓
inspect per-target results
      ↓
verify independentlyConfirmation records acceptance of the prepared action. It does not prove that every device accepted the command or reached the intended state.
7. Use incidents when the work needs ownership #
Alerts say that a condition deserves attention. Incidents add the operating record:
- state and ownership
- first-observed time
- notes and evidence
- corrective action and approvals
- customer or status communication where appropriate
- verified recovery
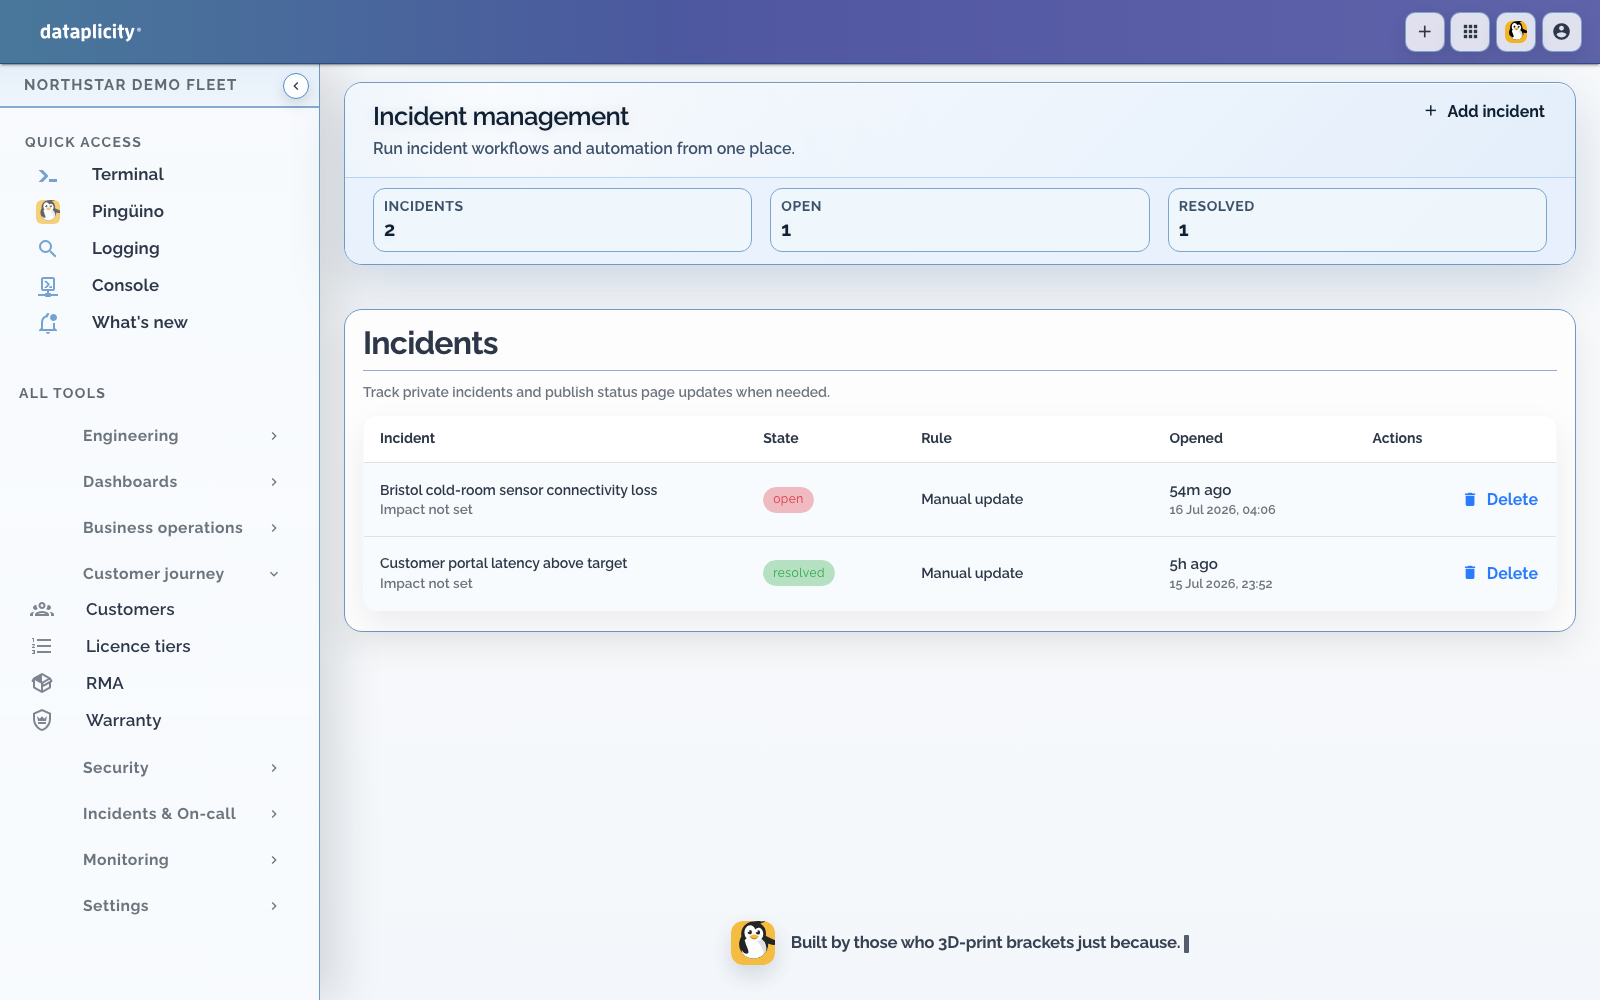
A useful incident entry does not copy every log line. It links the scoped query, records the interpretation, names the action, and states the independent recovery signal.
8. Choose the right command surface #
Dataplicity has multiple control surfaces because interactive operations and external automation have different trust boundaries.
| Need | Use |
|---|---|
| Contextual operator work with no local install | Web CLI |
| Device-level interactive diagnosis | Remote Shell |
| Supported local terminal workflow | Native Dataplicity CLI |
| Repeatable multi-device action with per-target results | Fleet jobs |
| External integration or automation | Documented Gateway API |
An organisation API key does not expose private dashboard or Web CLI calls as a public API. Build external automation against documented Gateway endpoints rather than captured browser requests.
9. Keep platform permission and Linux permission separate #
Dataplicity roles, team membership, API scopes, and confirmation steps determine who can request an action. The device's Linux configuration determines what that action can do.
The standard agent runs under its configured OS identity. Terminal commands, file operations, and fleet commands inherit that identity's groups, filesystem access, ACLs, credentials, and sudoers policy.
A browser control does not inherently become root. If an administrator grants broad groups, blanket sudo, or additional credentials, that is an explicit expansion of the device-side boundary and should be reviewed accordingly.
End-to-end operator recipe #
Scenario: Bristol Freezer Sensor 01 is offline and the customer reports a temperature-data gap.
- Search inventory and open the full device hash.
- Confirm customer, site, class, firmware cohort, and ISP property tag.
- Open the matching fleet monitor to see whether peers crossed the threshold.
- Search logs from just before the last heartbeat.
- Compare the unit with a healthy freezer sensor.
- If the device returns, use the device workspace for a bounded read.
- If several devices need the same safe action, prepare a fleet job against the previewed cohort.
- Inspect every target result.
- Record the action and verify recovery through new telemetry or the relevant service monitor.
Work through the complete exercise in Diagnose the Northstar cold-chain incident.
Production checklist #
- [ ] Operators know the difference between inventory, device, log, monitor, job, and incident surfaces
- [ ] Full device hash is checked before mutation
- [ ] Fleet selectors are previewed before dispatch
- [ ] Web CLI use begins with session
help - [ ] Structured output is used only when advertised
- [ ] Guarded confirmation codes are never reused
- [ ] Per-target job failures are reviewed
- [ ] Platform roles and Linux permissions are tested separately
- [ ] Recovery is verified outside the action surface
Continue the series #
- Logging for a fleet, not a terminal
- Run the fleet from one browser workspace
- Monitor the cohort, not just the device
- Request the evidence now; let connectivity catch up
- Lab: Diagnose the Northstar cold-chain incident