

Appearance
Operate your own Linux fleet #
If your company builds the Linux devices that your own business operates, this is the Dataplicity path for you.
You might run controllers across fuel sites, gateways in factories, telemetry stations, kiosks, roadside equipment, agricultural systems, signage, building controls, or another proprietary operational fleet.
You do not need a Customer Portal or downstream customer organisations. The operating question is:
How do we know what is actually deployed, see when part of the fleet is going wrong, understand why, fix it safely, and prove that it recovered?
text
know the estate -> watch it -> find the odd population -> investigate -> act -> verify -> learnThis is one of Dataplicity's original strengths. Remote shell is useful, but a long-lived fleet quickly creates harder questions than "can I log in to this device?"
- Which devices are still on an old software or runtime generation?
- Is this fault one device, one site, one network, one hardware generation, or one release cohort?
- Which devices no longer resemble the rest of the product line?
- Did yesterday's maintenance actually change every intended device?
- Can support establish enough evidence to avoid a field visit?
- Did the remediation restore the product, or did the command merely finish?
Customer Portal is optional
Everything here is about the internal Dataplicity engineering and operations workspace. Product Applications and Customer Portal are additional capabilities, not prerequisites for running your own fleet.
The example #
Imagine a company that built a Linux field controller for its own operations. It started with 30 devices and now has 2,400 across several regions.
The estate contains three hardware generations, old and current Linux images, more than one supported application release, legacy runtime populations, several WAN types, devices that are sometimes legitimately offline, and sites where sending a technician is expensive.
That is a normal mature fleet. Operations need to know which populations exist, which differences are intentional, and which differences need attention.
1. Make the fleet understandable #
Start by connecting a representative device, then record the facts that matter operationally: hardware/product generation, asset identity, site or region, role, release cohort, connectivity cohort where relevant, and Device Class.
Use Device Classes for populations that should broadly behave like the same product. Use networks and tags for operational scope such as region, WAN type, staged rollout, or maintenance group.
Do not create taxonomy for its own sake. Every property should help answer a real question later.
text
Field Controller V2
  -> Queensland
     -> cellular
-> release-4.8-canaryNow support can ask "is the problem all V2 units, only Queensland, only cellular, or only yesterday's canary?" before touching a device.
2. Know what is actually deployed #
Open the relevant Device Class, then select Pulse. Pulse is now the class intelligence workspace. Its navigation combines two kinds of evidence:
- Makeup shows the current populations Dataplicity can query, such as application version, image build, OS, agent version, connection state, and tags.
- Findings shows explainable differences from the class peer model once enough recent devices have participated.
Start with makeup. In this Field Controller V2 class, release 4.8.0 is still on 264 of 462 devices. That is an investigation-ready population, not a firmware-unknown table.
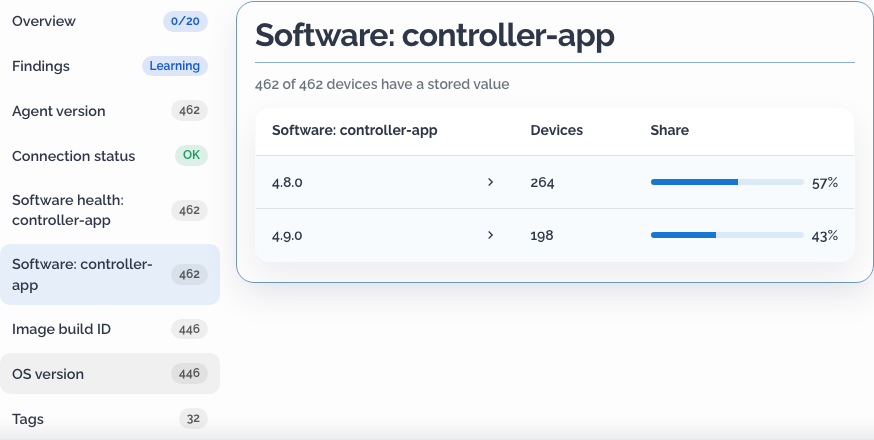
Select the 4.8.0 row. Dataplicity opens the device list with the Device Class and software-version filters already applied.
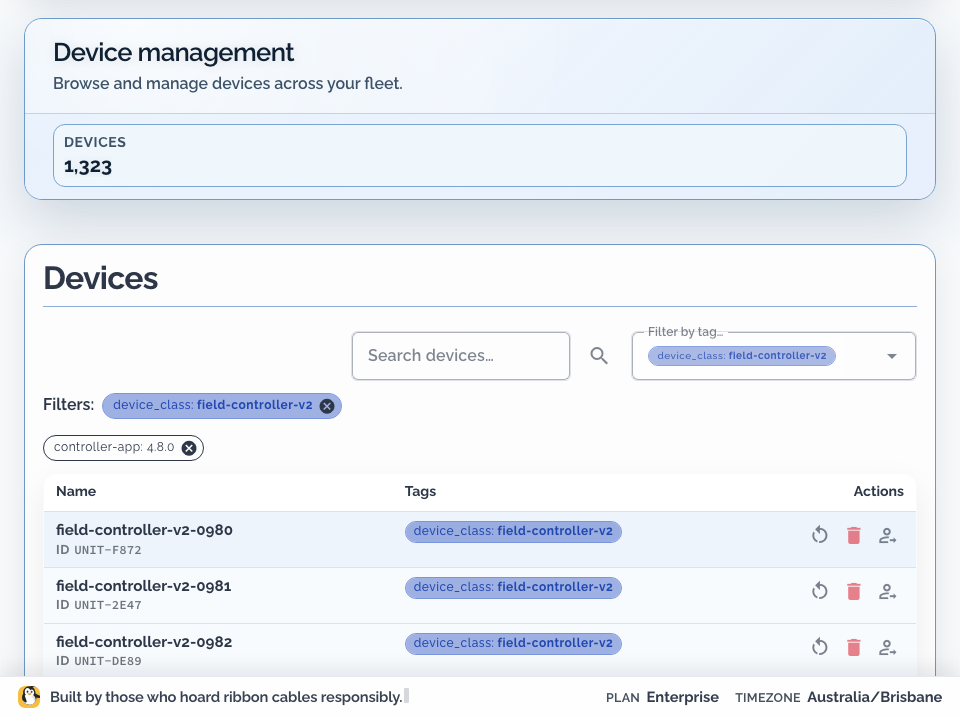
Repeat this with image build, OS version, agent version, tags, or another stored fact. Missing values appear as No value reported rather than being guessed or silently dropped.
Some facts are observed by Dataplicity. Others are product-specific facts you deliberately publish because they matter to support. If Python version affects supportability, publish it as an inventory fact rather than discovering python --version one device at a time.
Makeup is current state. Do not treat it as a historical distribution unless the product has a genuine timestamped source for that fact.
3. Monitor what means "the product needs attention" #
An online agent proves that Dataplicity can currently reach the device. It does not prove your product is working.
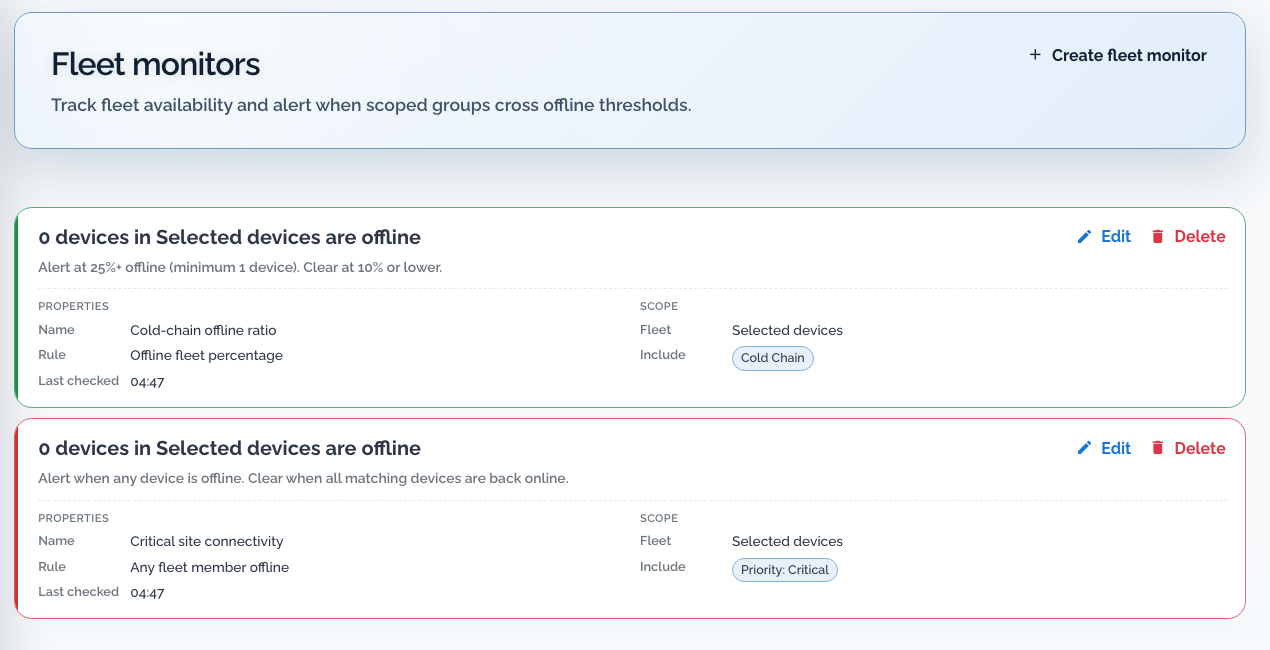
Use monitors and alerts for known conditions that should create action: connectivity, an expected heartbeat, a critical service/process, an application endpoint, a product-specific health signal, or an upstream dependency whose failure would otherwise make healthy devices look broken.
Monitor at the altitude at which somebody can act. "One of 2,400 devices disconnected for two minutes" is rarely a useful page. "Twenty percent of controllers at these six sites missed their expected check-in" may be an incident.
For intermittently connected products, define expected absence. A device that intentionally sleeps for six hours is not unhealthy merely because it is not continuously online.
4. Build dashboards around decisions #
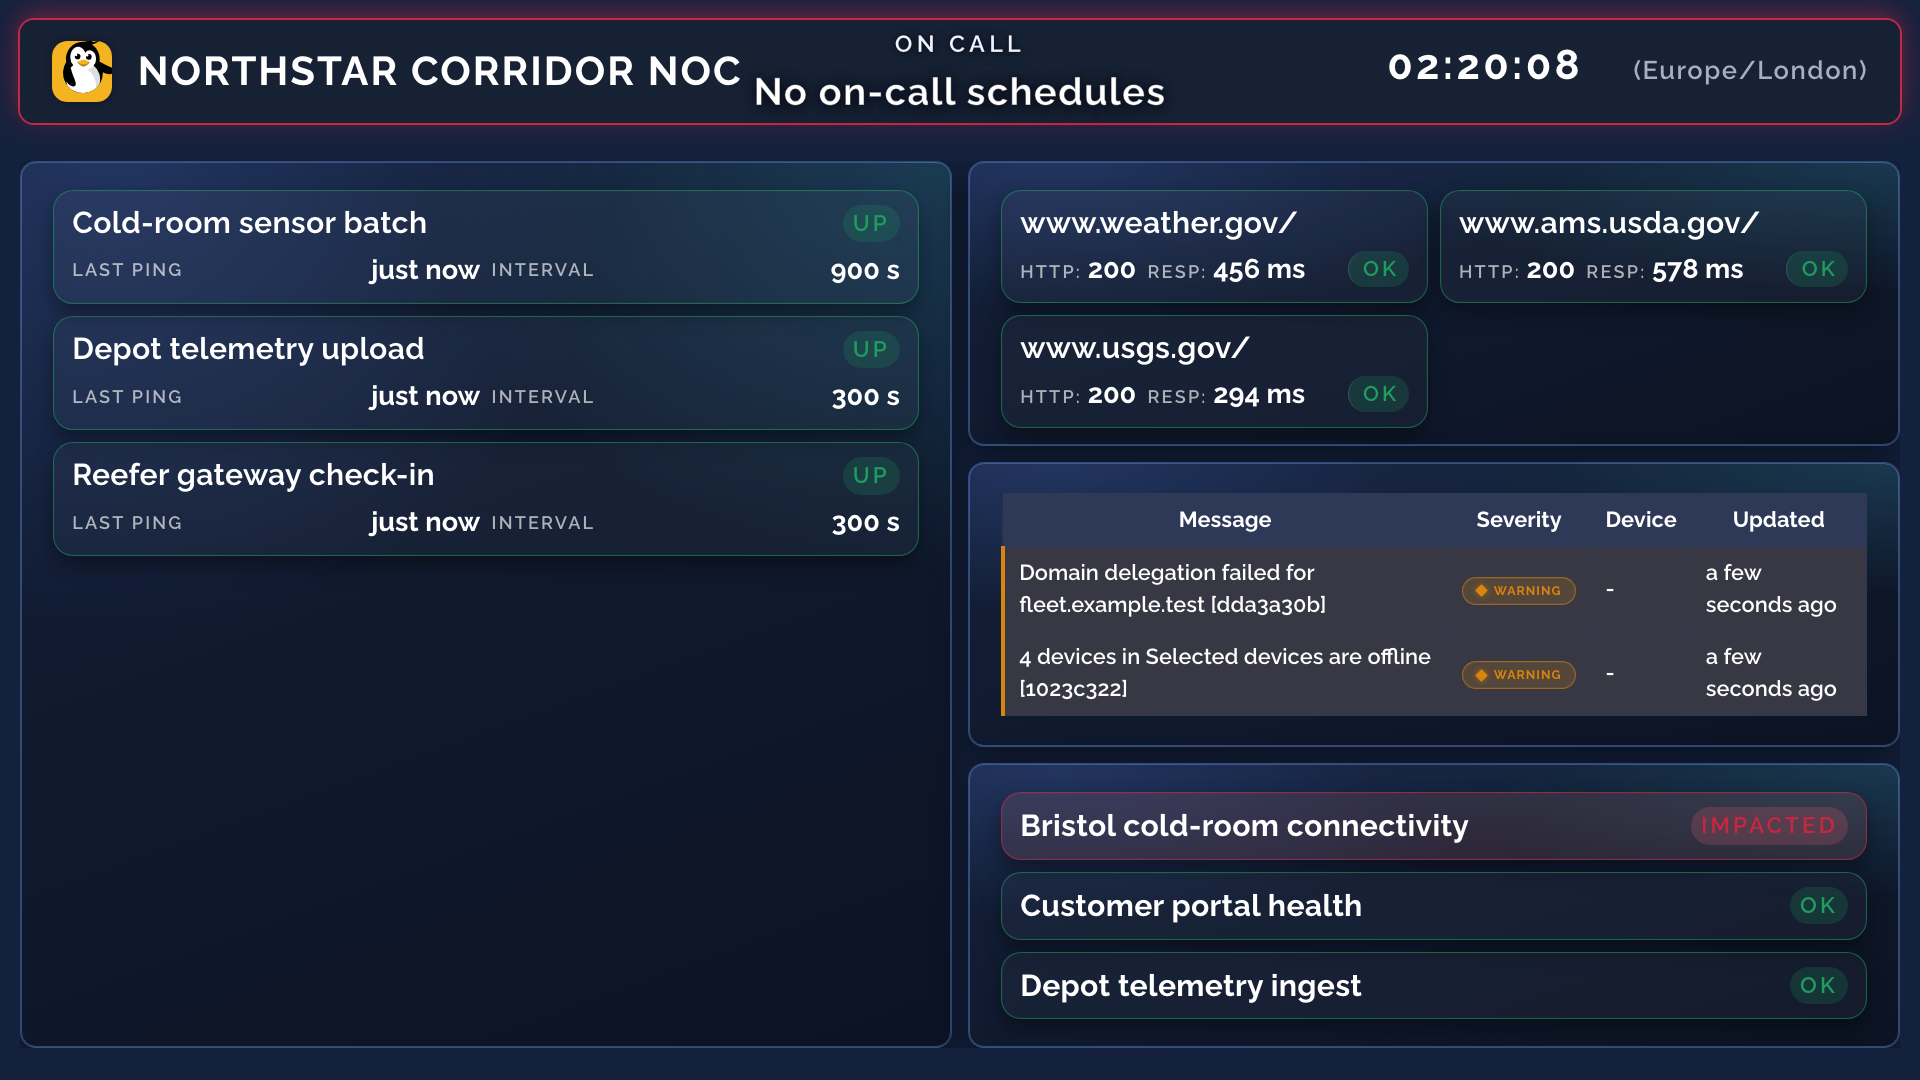
Dashboards and displays are useful when they answer a question somebody actually asks during a shift:
What needs attention, how broad is the problem, and what changed recently?
Depending on the data sources and widgets enabled for your organisation, useful views can include current monitor/alert state, active incidents where enabled, site/fleet scope, current job activity, product/class cohorts, and evidence needed by the team using the screen.
Do not make a wall of every metric you can collect. A release engineer, NOC operator, and field-service team do not need the same wallboard.
A dashboard is not monitoring. Dashboards help humans understand state; monitors and alert routes determine when somebody needs to act.
5. Use Pulse makeup and findings together #
Monitors are prescriptive: you decide what condition matters.
Device Class Pulse asks a different question:
What is this class made of, and which devices no longer look like their peers?
Makeup is useful immediately. Tiny classes show per-device facts; larger classes show current distributions. No separate Fleet composition tab exists. Older links to that tab open Pulse.
Peer findings need a reliable baseline. Overview and Findings appear when a class has at least 20 enrolled devices, and the model becomes ready after at least 20 recent successful fingerprints contribute to the same collection slot.
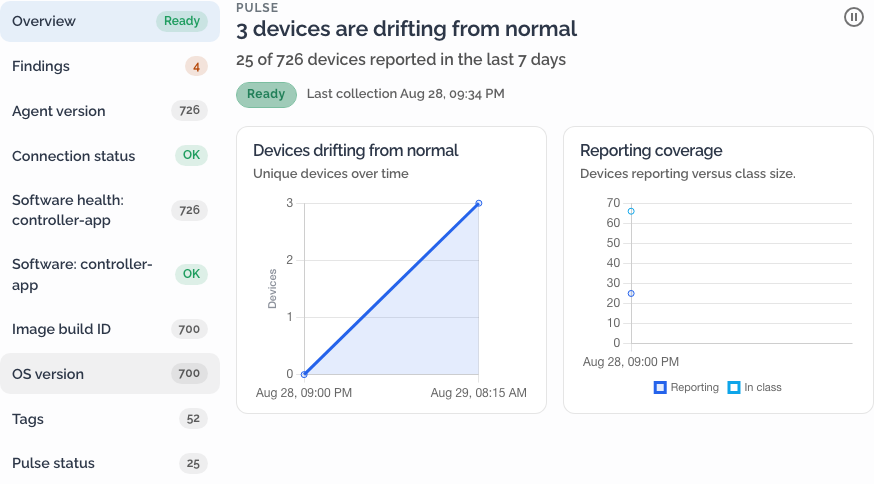
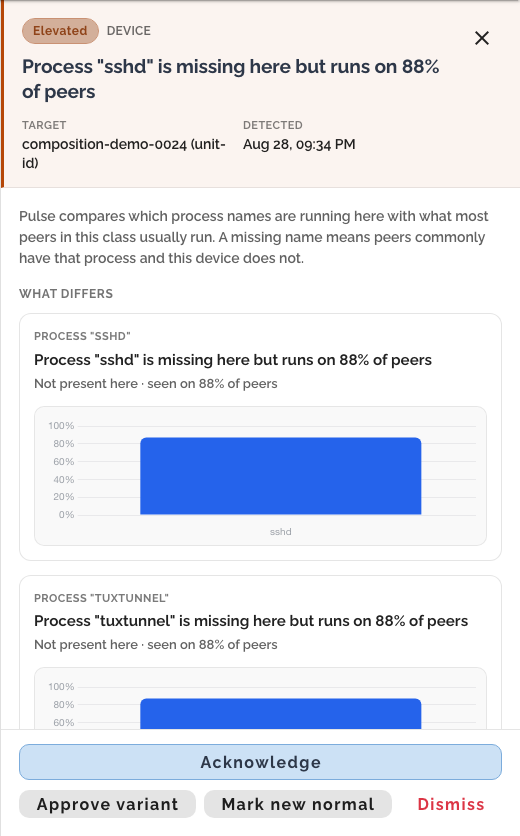
A finding might show a normally present process missing on six devices, an unexpected process in a small cohort, a different OS identity, a selected binary checksum differing from peers, or resource posture outside the peer band.
Pulse is observational. It does not auto-remediate, and its similarity score is not a diagnosis. The value is the explainable difference that gives engineering somewhere sensible to look next.
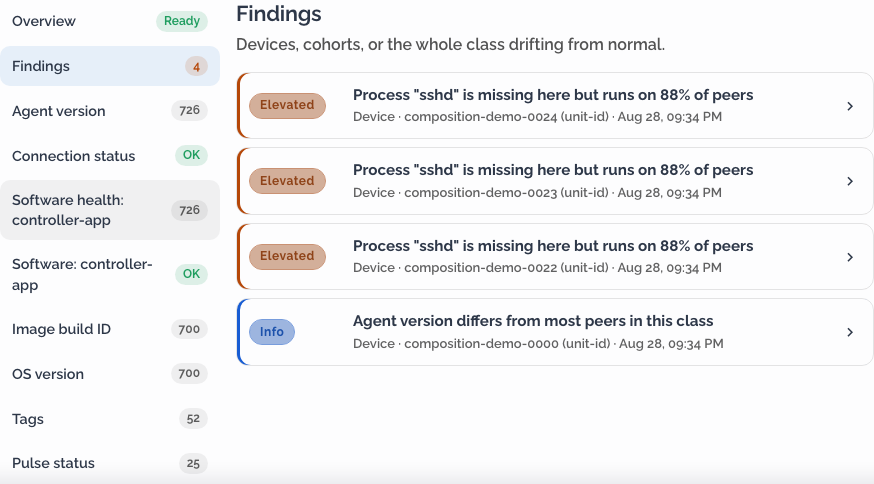
Open a finding to see the observed signal and its peer evidence. Device identifiers in these examples are deliberately obfuscated.
6. Work incidents from the fleet down, not the shell up #
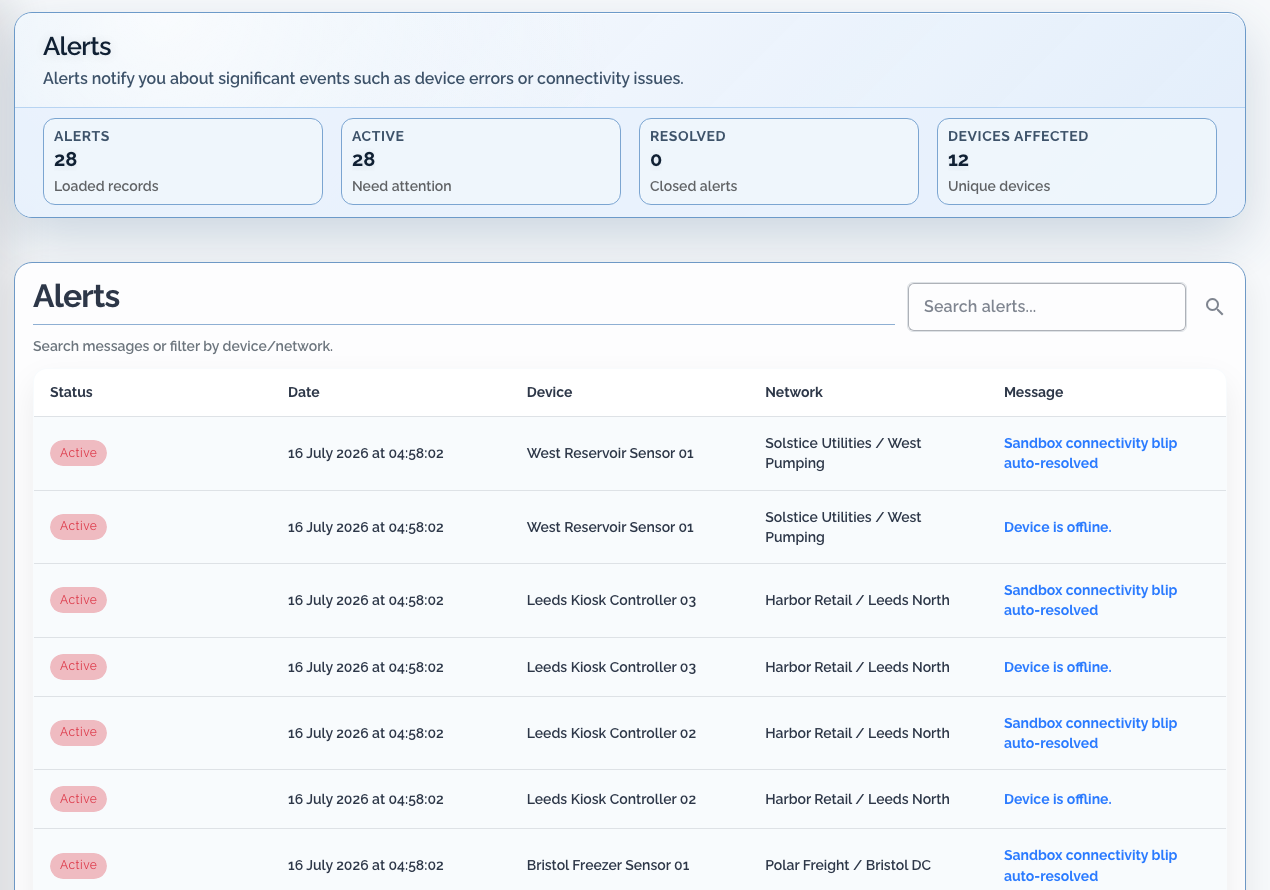
Suppose an application-health monitor begins failing after a release.
The tempting response is to open the first red device and start typing. That loses the most valuable information: scope.
Use From signal to verified recovery: establish ownership and impact, identify the affected population, compare it with healthy peers, gather evidence before changing anything, take the smallest safe action, then verify recovery independently.
Ask:
- Is the fault limited to one Device Class?
- Does it align with one site or WAN provider?
- Did every affected device receive the same release?
- Are healthy devices running that release on another hardware/image cohort?
- Does Pulse show a common difference among affected units?
text
Observed: application health failures on 41 controllers
Scope: V2 only; all affected units are in yesterday's 4.8 cohort
Healthy comparison: V3 devices on 4.8 remain healthy
Recent change: rollout began at 14:00 UTC
Next check: compare affected V2 units with healthy V2 peersThat is already more useful than "SSH works."
7. Compare populations before diagnosing one box #
Use shared evidence before descending to one host: Device Class/tag membership, monitor history, logs, device timeline, Pulse findings, Fleet Job history where relevant, connectivity context, and product-specific fleet facts you deliberately expose.
Suppose affected devices are all older V2 images while recently rebuilt V2 devices are healthy on the same application release.
Now the question is:
What differs between the old-image V2 cohort and the healthy V2 cohort?
That is where OS/runtime/package/process evidence becomes useful. It might be Python, a shared library, configuration, a kernel feature, or something else.
Do not fake a retrospective query if the required fact was never collected. If a missing fact would have materially shortened the investigation, make it part of fleet evidence before the next incident.
8. Diagnose a representative device when host detail is needed #
Once fleet evidence has narrowed the problem, choose one affected device and one healthy peer from the same class/cohort.
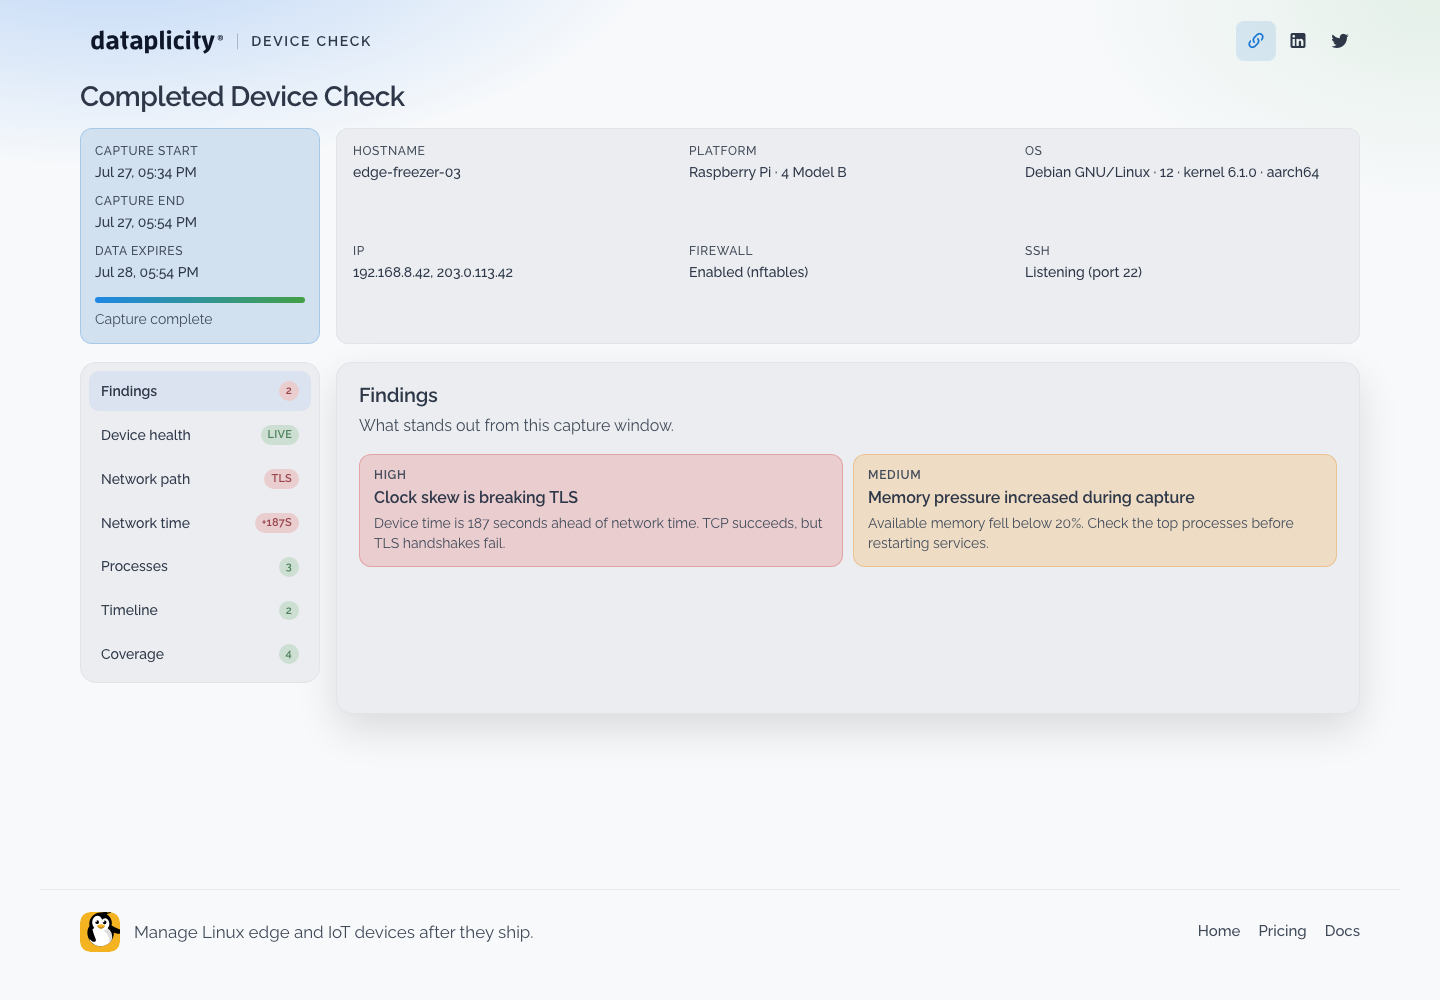
Start with the least invasive evidence available: connection/check-in history, monitor evidence, logs, process/service/resource state, Device Check, and network/DNS/clock checks where appropriate.
If you need interactive host inspection, open Remote Shell.
Dataplicity Lens is an open-source on-host inspection toolkit for Linux and macOS. Use it from the shell for structured process, service, log, storage, networking, and hardware views. Lens is not currently a cloud-side queued diagnostic service.
Fleet evidence tells you which device to inspect and why; shell/Lens gives you detailed host evidence once selected.
9. Make a bounded change across the right population #
Once you understand the fault, define the target and expected result before acting.
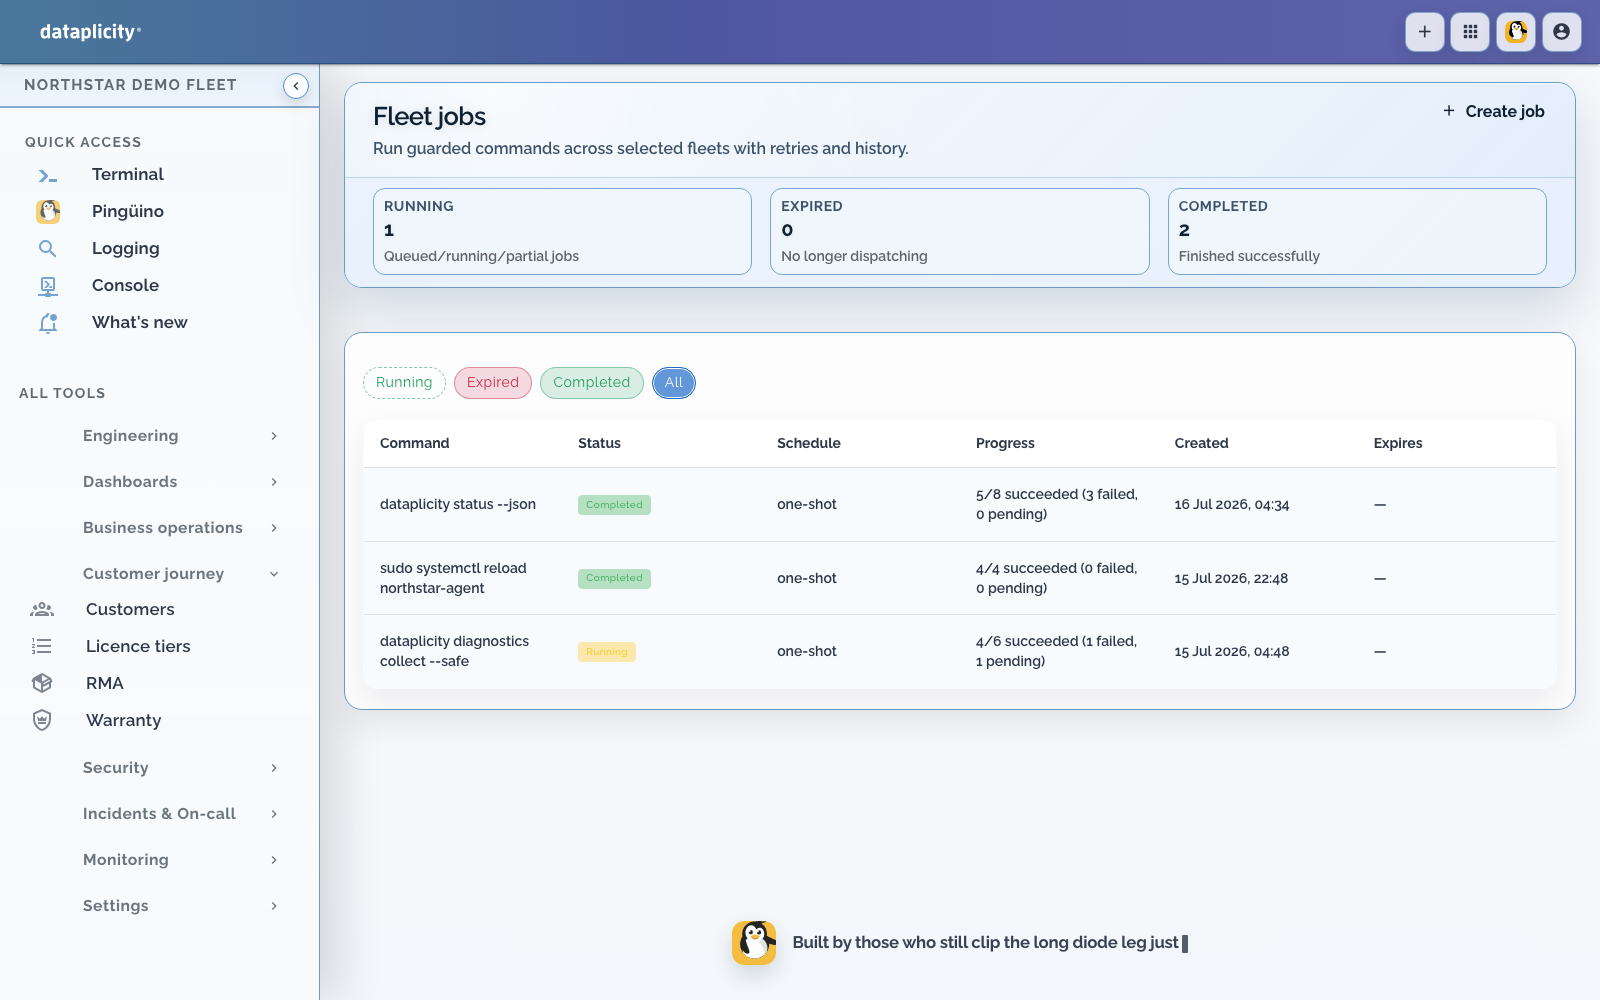
Fleet Jobs can fan out one non-interactive command to devices selected by tags. The current flow includes target preview, timeout/expiry controls, progress, and per-target results. That makes it useful for bounded diagnostics or operational changes when the same command is appropriate across a selected cohort.
It is not a substitute for every firmware/application deployment system. If your product uses RAUC, SWUpdate, Mender, containers, a custom updater, or another delivery mechanism, keep it where it makes sense. Dataplicity can sit beside that runtime rather than forcing replacement.
Dataplicity commands inherit the agent's effective device-side Linux identity. Remote access does not automatically make an unprivileged process root.
For a release incident: stop widening the rollout, select only the known affected cohort, run the approved rollback/fix mechanism, leave disconnected devices unresolved until they can receive it, and separately track anything requiring manual intervention.
10. Verify the product, not the command #
A successful command or completed Fleet Job proves an action completed. It does not prove the product recovered.
Verify independently: the service monitor becomes healthy, error volume returns to normal, the affected population shrinks, the problematic peer difference disappears, no adjacent cohort regresses, and disconnected devices remain visible as pending work.
Only then is the incident recovered.
11. Apply the same discipline to releases #
The best time to find a bad cohort is before rollout reaches the whole fleet.
text
understand current populations
-> select representative canaries
-> make the change
-> watch health and fleet differences
-> verify canaries independently
-> widen the rollout
-> find devices that did not convergeFleet Jobs support this style because you can target a controlled tag cohort and inspect per-device results. Where a dedicated firmware deployment workflow is available, use its additional bundle, eligibility, rollout, and deployment-result semantics.
Do not report "100% deployed" because 200 offline devices were never attempted. Not attempted, attempted and failed, and verified healthy are different operational states.
12. Use fleet evidence for lifecycle work too #
A long-lived Linux fleet accumulates technology generations whether you plan for it or not.
Periodically ask:
- Which hardware generations are approaching end of support?
- Which application/image generations should no longer exist?
- Which devices repeatedly miss maintenance/check-in windows?
- Which devices are chronic Pulse outliers?
- Which sites/connectivity cohorts generate disproportionate incidents?
- Which support-critical runtime/package facts show populations that should be migrated?
For a Python product, that might mean locating every old Python population and planning migration deliberately instead of discovering it during the next release.
The current Pulse makeup shows what devices report now. Historical fleet distributions require a genuine timestamped source and are not part of this walkthrough. Keep lifecycle records in the systems that actually own them until Dataplicity exposes that history directly.
What this gives an internal owner-builder #
Engineering judgement is still required; Dataplicity gives it fleet context.
Dataplicity provides the shared operating layer around the Linux product your company built: Device Classes and fleet organisation for scope; monitoring for known failures; Pulse for peer drift; dashboards for operational altitude; logs/timelines for evidence; incidents/on-call where enabled; Fleet Jobs for bounded fleet work; and Remote Shell, Wormhole, Device Check, and Lens for deeper diagnosis.
An investigation should move from:
"Something is wrong with device 471."
then:
"The problem is the old-image V2 cohort that received yesterday's release."
and finally:
"The affected cohort has recovered, and these seven disconnected devices still need the change."
That is the difference between remote access to a fleet and operating a fleet.